
As we approach the end of the year, I thought I'd roll up some statistics that people occasionally ask about.
As a baseline -- per Quantcast, the Stack Exchange Network is ranked #364 in overall USA network traffic, and Stack Overflow itself is ranked #598.
These numbers are from Google Analytics for the period of January 1, 2010 to December 14, 2010.
Where in the world do Stack Overflow users come from?
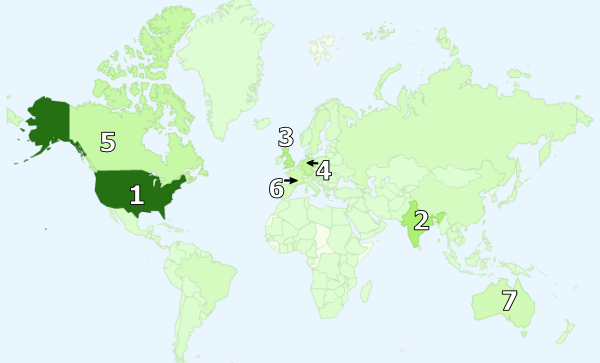
United States 30.5% India 8.6% United Kingdom 7.2% Germany 4.7% Canada 4.1% France 2.7% Australia 2.7% Netherlands 2.0% Italy 1.9% Brazil 1.7%
Compared to last year's numbers, the trend here is basic globalization 101 -- more and more traffic from outside the USA over time, where the US dropped from 36% to just 30% of the total in a single year. The top 10 countries only account for 66% of traffic overall, down from 71% last year.
How do Stack Overflow users find the site?
Google (organic) 87% Direct 6.0% Bing 0.9% Google (referral) 0.9% Reddit 0.6%
No, Google isn't a monopoly, they just play one on the internet. Just kidding! please don't hurt me mister googles
What web browsers do Stack Overflow users use?
Firefox 44.1% Internet Explorer 22.7% Chrome 22.6% Safari 7.4% Opera 2.4% Mozilla 0.5%
Note that within Internet Explorer, the breakdown is 60% IE8, 26% IE7, and 13.5% IE6. The Firefox breakdown is primarily 3.5 and 3.6, with a smattering of older versions. Chrome is ... all over the map, probably because by the time you read this, they've incremented the version again.
The big news here relative to last year is the huge jump for Chrome, mostly coming at the expense of IE and Firefox.
What operating systems do Stack Overflow users use?
Windows 74.7% Mac 14.7% Linux 9.5% iPhone 0.4%
We didn't report these stats for last year, but I doubt they are terribly surprising to anyone.
What screen resolutions do Stack Overflow users have?
1280 x 1024 18.6% 1280 x 800 14.0% 1680 x 1050 13.5% 1440 x 900 11.4% 1024 x 768 8.2% 1920 x 1200 8.1% 1366 x 768 4.3% 1600 x 1200 2.3% 1600 x 900 1.6% 1152 x 864 1.1%
This is very good news compared to last year! What I mainly look at here is the horizontal width. We design for a fixed minimum width of 1024 px and that stat declined from 12% to 8% over the last year.
So there you have it -- a profile of the average 2010 Stack Overflow user, at least for these metrics! I think this covers most of the questions I see asked on meta about our analytics, but if there are any other metrics you think might be useful to share, make a case for them in the comments.