Introducing Stack Overflow Trends
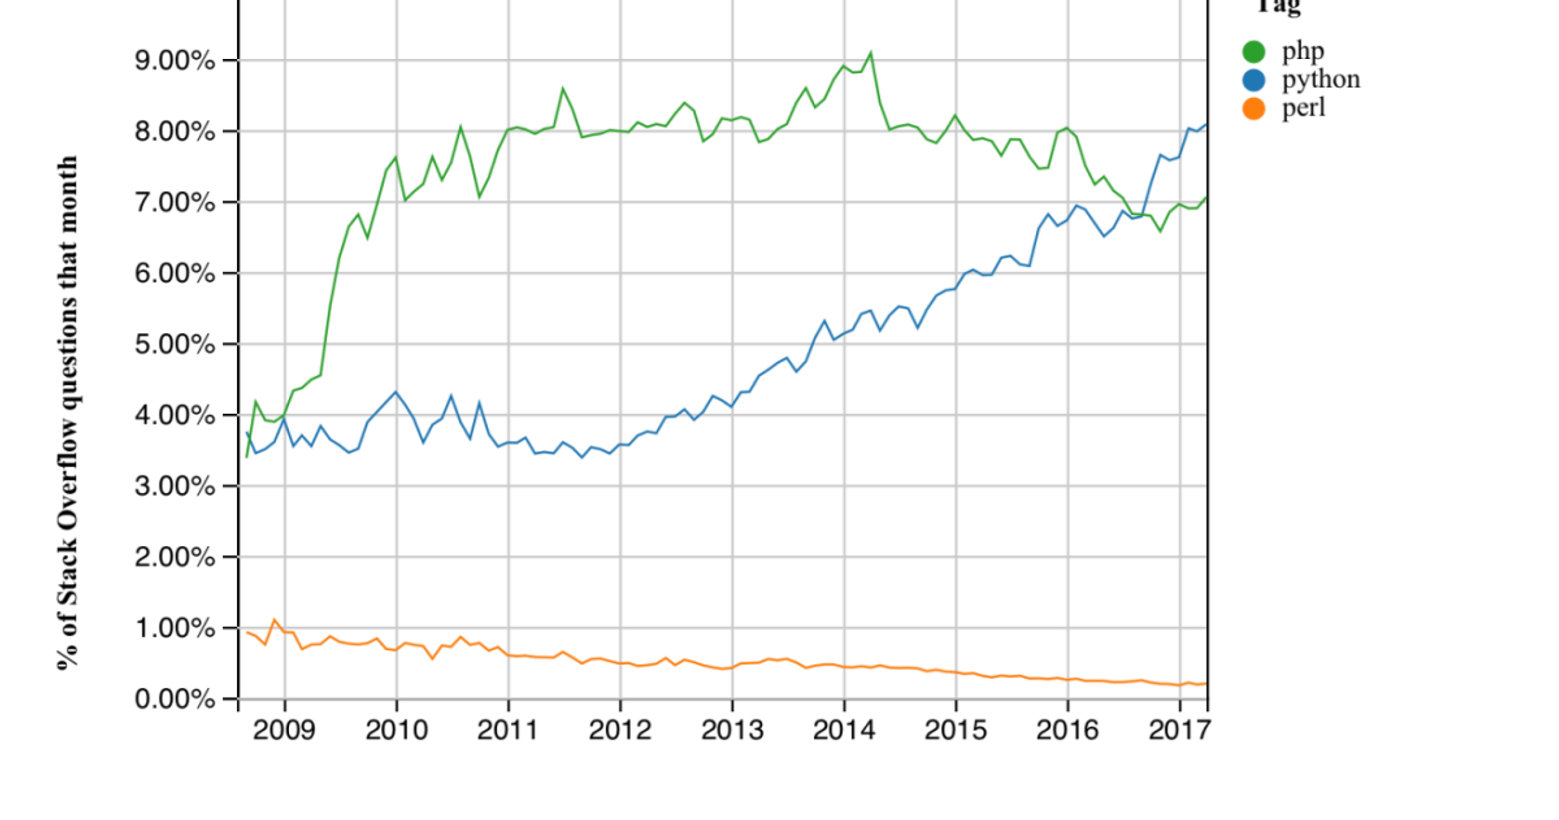
On a typical day, developers ask over 8,000 questions on Stack Overflow about programming problems they run into in their work. Which technologies are they asking about, and how has that changed over time?
Today, we’re introducing the Stack Overflow Trends tool to track interest in programming languages and technologies, based on the number of Stack Overflow questions asked per month. For example, we could compare the relative usage of three programming languages.
Here, we can see that questions about the Python programming language have become rapidly more common over the last few years. (In data from Stack Overflow Talent we’ve seen the same expansion in companies looking for Python developers). PHP was growing for several years, but has since leveled off. Perl was never as big a presence on Stack Overflow, and questions about it have become steadily less common in the last 9 years.
Measuring developer interest based on Stack Overflow questions isn’t perfect: some technologies might inspire more questions among its users than others. But we’ve found it’s a simple measure that gives useful insights into the developer ecosystem. It’s especially useful for measuring changes over time: when we see a rapid growth in the number of questions about a technology, it usually reflects a real change in what developers are using and learning.
Here we’ll share a few examples of insights we can extract from the Stack Overflow trends tool.
JavaScript frameworks
JavaScript open-source web frameworks show some of the most interesting patterns of growth and decline.
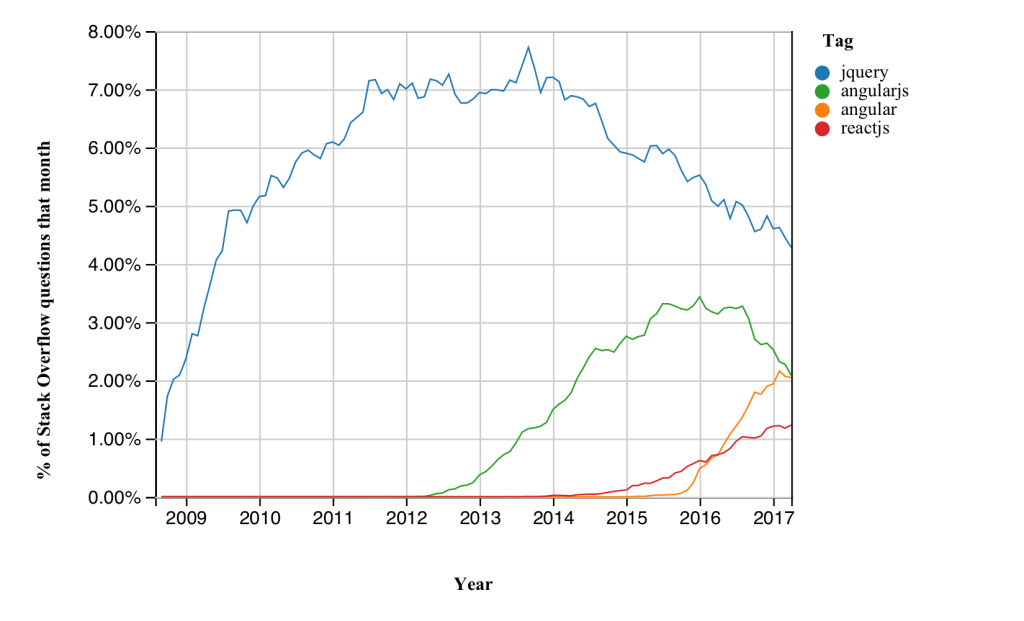
JQuery used to be among the most popular tags on Stack Overflow (as some have humorously observed), but it has made up a smaller share of questions as newer web frameworks have been introduced. There’s been extraordinary growth of the angularjs tag (representing the first version of the framework) since 2013, then a quick shift to the angular tag (representing subsequent versions). We also see fast growth in the React library. These tags are among the most prominent JavaScript projects on the site.
Smaller web frameworks show a brutal life cycle, where some show rapid growth then decline over the span of a few years.
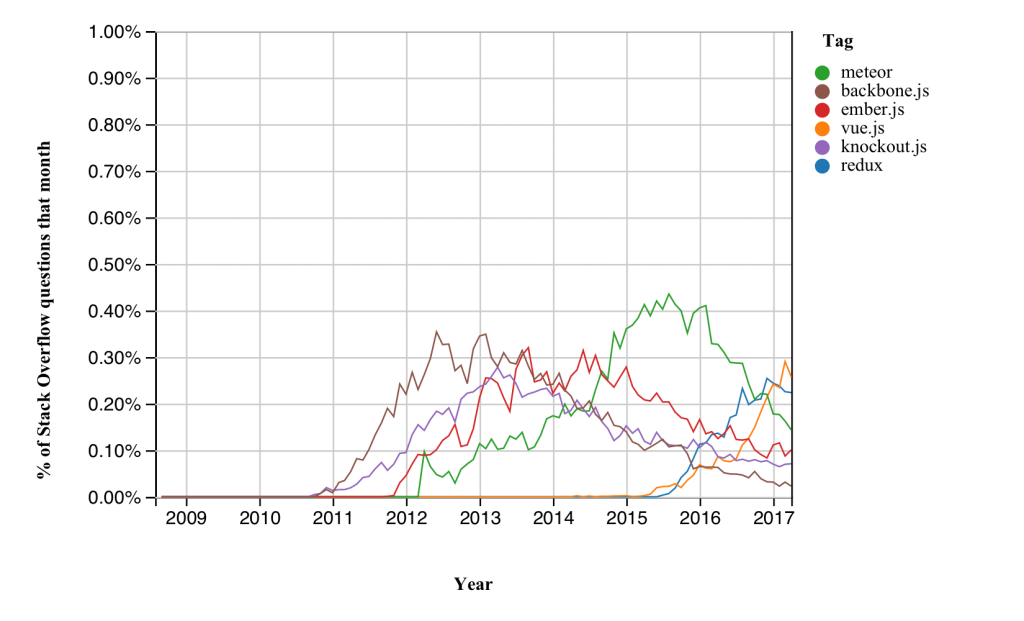
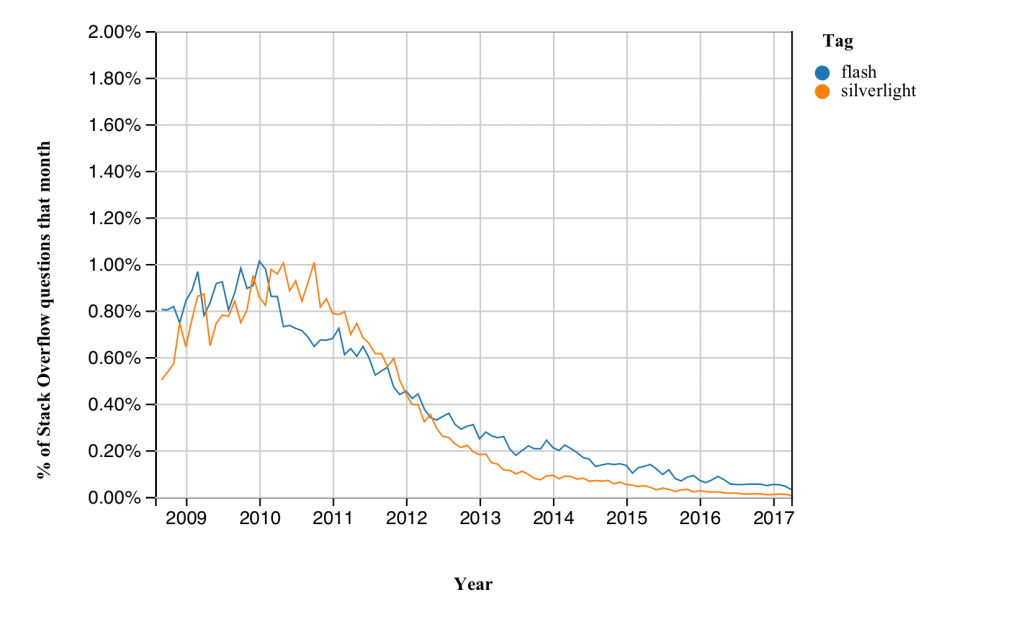
The Vue.js framework have shown quick adoption (and in terms of year-over-year growth is one of the fastest growing tags on the site). Frameworks like Backbone.js, Ember.js, and more recently Meteor appear to be in the later stages of the life cycle.
Overall, front-end web development has largely been moving away from closed-source plugins, including Adobe Flash or the now-deprecated Microsoft Silverlight. In 2016 these each made up less than .1% of Stack Overflow questions.
Data Science and Big Data
Technologies used for data science have shown particularly rapid growth over the last few years.
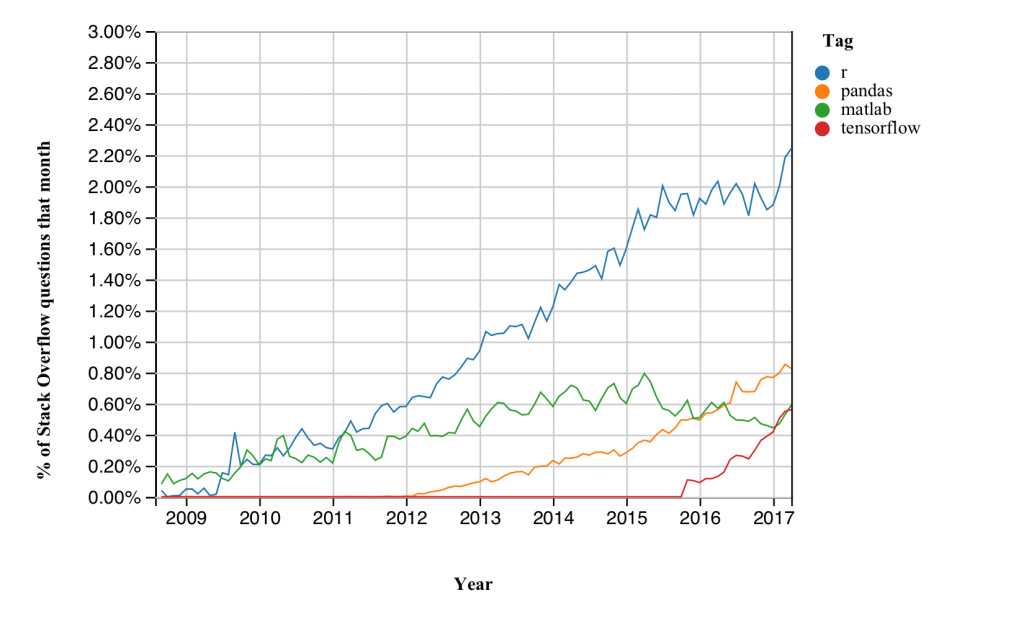
The R statistical programming language has shown consistent growth, as has pandas, a popular library for data science in Python. The closed source MATLAB language was growing for most of the lifetime of the site, but has more recently leveled off and may be shrinking.
TensorFlow, Google’s open-source machine learning framework, was introduced only in late 2015, but it’s been growing at an extraordinary pace. Among the 500 largest tags, only swift3 has shown faster growth in the last year.
Similarly, there’s been expansion of interest in big data frameworks. We can compare several major Apache open-source projects for storing and processing large datasets.
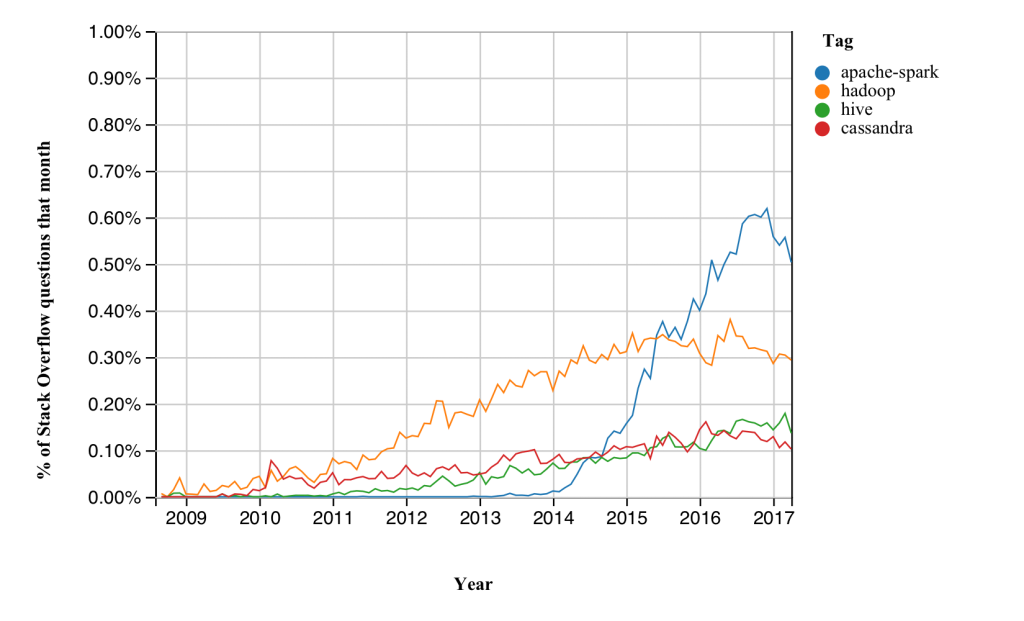
Hadoop has grown since 2009, and so more recently has Hive, a query system built on top of Hadoop. Interest in Cassandra has remained steady for several years. But Spark shows the fastest surge of adoption, becoming the most asked about technology just a few years after its introduction.
Try it yourself!
Don’t see your favorite language, technology, or framework in this post? Use the Stack Overflow Trends tool to create your own graphs, and see what you can learn about how the developer ecosystem is changing and where it might be going in the future.
91 Comments
The steep inclination in the R definitely does ring a bell. A big fat church bell probably.
Nice to see R is keeping up the growth. Pandas fans would have you believe otherwise.
TensorFlow, Google’s open-source machine learning framework, was introduced only in late 2015, but it’s been growing at an extraordinary pace. Among the 500 largest tags, only swift3 has shown faster growth in the last year.
Very cool! I happened to make the same thing, but for startup jobs: https://betalist.com/jobs/trends
Are the tags available only a subset? I wasn’t able to add `mesos` for example.
Yep- only ones with at least 2000 questions on Stack Overflow, I’m afraid
Why is that out of curiosity? Seems harmless to allow anything.
First reason is performance; the Trends page doesn’t make any asynchronous calls; it frontloads the per-month data (currently) 1.4 MB JSON dictionary, and shrinking the tag size limit expands that size a lot (we include about 2100 tags here, but there are 40K tags in total).
Second reason is that a lot of rare tags look really crummy as line plots, due to noise between months.
Third reason is it makes the auto-suggestion more useful. Try typing in “android” and you’ll see it suggests about 43 different tags. Now imagine that for almost anything you’re typing (type “node” for node.js and get nodemon, nodeclipse, nodetool, and other obscure tags), and most of the tags being uninformative when rendered. This helps point users towards the tags that are worth graphing.
It’s not the only choice we could have made, but I hope these reasons help explain it!
Any chance the code for this open source? Would love to see some specific tags that are at the 1000 questions mark.
Php questions being asked is in decline, but is the frequency of existing question views going down?
In addition to showing questions asked, it might be good to show page-views — i.e., people who googled a question and landed on the stackoverflow page and found their question answered.
It will bring earth quake on every ones mind.
it looks a bit wired to see php loose share to python after php7 which is way faster than python
Still not threaded though 😛
I think that speed is one of the least interesting factors when choosing Python over PHP; besides, it’s not like web development is the only kind development happening, and outside it PHP is virtually nonexistant (unlike Python).
StackOverflow keeps delighting us. Keep up the good work, guys!!!
P.S. Long live language wars supported by statistical data )
As several others here suggest, I think that the frequency of questions is an inaccurate measure of popularity. The frequency of questions could reflect several factors other than popularity. Complexity, version changes, new user influx, immaturity of the technology. Experienced users don’t ask (as many) questions. So the user base for a technology could be vast- but the experts who are current users will not be posting questions.
Even page accesses don’t tell the whole story. I very rarely, if ever, have to ask questions of anyone about systems I’ve used the longest- but those systems are the backbone of my paying work. For example, a very experienced developer would have no occasion to post a Transact-SQL question. But SQL Server might be at the core of all of their work.
To score high on this questions-posted measure, a technology would have to be complex: it would have to be new, it would have to be sufficiently complex to compel a user to seek outside help, it would have to be complex enough to give rise to vast numbers of non-repeated questions, and so complex that even experts never become so comfortable with the tool that they stop asking questions.
As a technology matures the frequency of questions ought to drop. Page views ought to drop.
So I’d say that it’s a very, very indirect measure of popularity.
Backbone is still the only MV* framework worth using.
It’s interesting that C# has been declining steadily pretty much single the start: https://insights.stackoverflow.com/trends?tags=java%2Cc%23%2Cc%2B%2B%2Cc
Is C# actually losing popularity? Or is it because SO was most popular among C# programmers in the beginning?
I think that highlights that tracking ‘interest’ in these technologies by tag activity needs to be taken with a HUGE pinch of salt
I think that’s because all the C# questions have already been asked and answered. This really doesn’t track the “fall” of technologies. I think it would be more insightful if there was a version of trends that tracked the number of page views per tag rather than questions asked.
Jon Skeet answered all the most important questions the first six month 🙂
I don’t know, the fact that a question has already been asked and answered doesn’t seem to prevent people from asking it again. (And again…)
It is an interesting point and a great idea. I think having the option to see the results either for views and for questions would go a long way to helping validate this theory. @disqus_2fRP1wjI8f:disqus – would this be possible? Does not sound hard…
The same trend is there for every traditional programming language. These are probably not becoming less popular, but they are a lower percentage of the total. The likely explanation is that the smartphone explosion has led to a ton of questions taking up a significant share of the total. Therefore you can’t really use “percentage of SO total” as a metric for popularity. You’ll have to compare the language with the equivalent alternatives.
Does the vertical metric represent the percentage of all Stack Overflow questions for a particular time period?
So could it be, for example, that
jquery
questions are holding completely steady month-to-month (hypothetically), while the total number of questions in all other languages are going up and down in the same time period?If that’s the case, then the above metrics aren’t as indicative of language popularity as they might seem at first.
The graph does only display relative popularity of technologies. If you can accept the premise that the community is (and always has been) a good representation of all developers, then the graph does also display the popularity of a particular technology over time, because if it is a fair subgroup of all developers, the percentage of questions asked per month is the same percentage of all developers.
Thanks for sharing the trends tool.
Very cool tool, thanks for sharing.
Please make the graph in the generator go down to 0 instead of just the lowest point in the line. Right now it’s very misleading.
This has been fixed, thanks!
Thanks sir ….. please any one help me to make a grabber script of http://www.bdlove24.com download site
Awesome info. That have sense to share with it
Nice good tool!
Cool!
It would be nice to have absolute numbers, rather than percentages. Also, it would be interesting to see a count of views by tag – if you’re interested in popularity, then questions that have already been asked and answered are interesting.
I agree with you! The tool is super cool but it would be even cooler with the specifications you describe!
This is awesome, thanks. Now, a plot which includes the [C#] tag does not include all posts under the [C#-3.0] or [C#-4.0] tags, right? If so, then what we now need is a way to hierarchically organize tags.
this has been asked for several times, they ALWAYS tell us no…
Interestingly, how tags could be organized hierarchically is a blog post I’ve been working recently! It won’t end up as a feature but there’s a lot that can be found from “tag X usually appears on questions with tag Y”, e.g. python-2.7 appearing with python.
I’m one of the ~10% of males who are colorblind. When adding a third item to the graph, its color is indistinguishable from the second item, to me.
Inspect the graph and change the colour. Each line is a separate element
Someone who’s colorblind should just change the color?
Sure, each line is separate, but it must be kinda tough for him to match those lines to the legend/tags.
Seems reasonable since we don’t know what colors a person can or can’t see; giving them the option to change any color or measure’s color is the best fit.
Most people who are color blind have Deuteranomaly. You can easily test colors to see if they comply with this type (and other types) using a color filter tool.
All you need do is change the “color” to “colour”. Then everyone can see it.
Are you doing any work to address communities or languages that don’t use SO, or are moving away from it? I know the Delphi tag has dropped off dramatically in the past few years, mostly because, anecdotally, of SO culture. (Lots of closed questions, deleted questions, etc – for that tag, today people seem to use SO as a read-only site, instead of as an active resource. You can verify this by comparing SO trends vs other language tracking, where Delphi is decreasing here but increasing in popularity in real life. I doubt it’s the only community to have this problem, and it will be especially visible in small communities.)
This is a worthwhile concern, but why are you confident Delphi is increasing in popularity in real life (as a relative portion of the developer ecosystem)?
In the last year Delphi dropped seven ranks on the TIOBE index (https://www.tiobe.com/tiobe-index/). And while I think the RedMonk programming language rankings stopped including the Delphi tag separately from Pascal in 2017, in the July 2016 data (http://sogrady-media.redmonk.com/sogrady/files/2016/07/lang.rank_.Q316.plot-WM.png) Delphi was one of the technologies most *over*-represented on Stack Overflow compared to # of GitHub pull requests. (Pascal was about even between the two metrics, and stayed that way in 2017).
What other language trackers are you referring to?
I’m sure (it has large communities elsewhere, including non-English) but the language itself isn’t a concern – it’s the SO culture. The question is, are SO addressing it?
You’re not paying attention. There’s nothing to address. And Delphi did not have “large communities elsewhere”; even the current language owner Embarcadero shut down their own Delphi forum.
You’re assuming that Delphi usage must be huge, so the Stack Overflow data must not be representative somehow, rather than using the vast sample size of Stack Overflow to adjust your belief to the reality that Delphi has very little market share.
Re: “at least 2000 questions”. Couldn’t you grandfather some of the oldies in (even with the noise), like Cobol and Forth? Especially as Cobol has been mentioned in some Stack Overflow podcast episodes.
I agree Peter. Though you have omitted RPG and REXX – heh, heh. I would have been interested in a chart like this when I used to ponder over the difference between an “Ordered Collection” and Linux.
I wonder some about what’s measured here… People post more on a given tag on SO when they have more questions about a given language. That could indicate that the language is popular, but it could also indicate that it’s confusing.
Could very well indicate that is: undocumented/poorly documented, or new, I don’t ask hardly any C# questions because they have already been asked, same for PHP, whereas R and Python 3 haven’t had as many answered (although this changes quickly!), it could also be that the languages themselves have better/lesser support forums, for instance Power Basic’s forums answer every question imaginable while PHP’s leave me frustrated and confused.
Pretty sure people will start abusing these trends thinking that one framework/language is better or more popular than the other. Don’t know how useful this is for programming society.
I don’t know of any language wars that have actually caused a language to die so I doubt things would change even with the inclusion of “Stack Overflow trend” graphs. It’s useful because it lets programmers escape the inherent myopia of their daily language or languages and provides them more perspective.
Arrays are three times more popular now (1.8%) than at the start (0.6%). Why is that? More n00bs? Does it mean I should be an array programmer? Will I get a raise if I do so?
Enjoy analysing these graphs–good work. Suggestion: improve difference between each line of the graph, especially when there are more than a few items. This particular graph has colours that are difficult to differentiate: https://insights.stackoverflow.com/trends?utm_source=so-owned&utm_medium=blog&utm_campaign=trends&utm_content=blog-link&tags=java%2Cc%2Cc%2B%2B%2Cpython%2Cc%23%2Cvb.net%2Cjavascript%2Cassembly%2Cphp%2Cperl%2Cruby%2Cvb%2Cswift%2Cr%2C
I think it is a interesting tool. It would be nice to have the possibility to choose between number of questions rate and page views rate.
how come I can’t do a trend on [webassembly], even though it is a tag?
Can you be mindful to those who are partially color blind on the graphs. I had trouble distinguishing
* React js vs AngularJS
* KnockoutJS,vs Redux
Great tool! Would be even more useful if it supported negative queries. For example tags: java -android would graph activity that has java but does not reference android (as to separate Oracle java versus android java activity).
That would be cool! But would also be computationally infeasible for this approach (here we just have a mapping of month + tag to percent, and it’s kept clientside)- to include negative pairs you’d need to query the full set of question/tag pairs each time.
The Stack Exchange Data Explorer would let you create queries like this, though! https://data.stackexchange.com/stackoverflow/queries
Interesting. Thank you for sharing this info. Regards.
To track interest in languages you should compare pageviews, not asked questions. More questions can rather prove that language is more confusing/poorly documented.
I agree. More pageviews might be close to what people are actually reading on, than questions asked, which means people are struggling with the language, in one way or the other.
Excellent point, but more pageviews may also indicate the same 🙂
So because a percentage is used then a surge in popularity in a widely used technology is going to make other technologies look like they are reducing in popularity even if their numbers are increasing albeit at a lower rate?
Just FYI, remember Correlation != Causation https://xkcd.com/552/
One should be aware that measuring popularity based on questions asked underestimates mature technology with good documentation. The hot new stuff with poor documentation naturally draws a lot of questions. I think this should change in order to base it on the number of people talking about it rather than the pure number of questions asked. If one person is asking 10 questions on some technology, does that mean it’s more popular than 5 persons asking one question each?
I concur with this as it was first take-away after getting past the GeeWiz initial glow of the tool. The sampling is skewed against more mature and favors those that are more kinetic in their evolution. The more stable a platform is the greater the likelihood that questions are resolved by the general consumers and therefore no need to ask questions in order to find necessary information.
It would be unscientific but I would love to see each of these charts contrasted against an actual survey of users. While this inherently would be flawed due to bias and level of participation by the community, it would prove to be an interesting comparison to make.
I don’t think it is appropriate to refer to this information as ‘indicating a trend’ as there simply isn’t sufficient quantitative data here to actually determine what is being used more than the next platform.
fucken diseased
awesome stuff!
one question though; why can’t i find some tags? does the trends tool not supporting all of the site’s tags?
for example, the ‘flowtype’ or the ‘jspm’ tags are available on the main site, but not in the tool’s tag autocomplete field..
that makes it hard to compare equivalent technologies, e.g. ‘typescript’ vs ‘flowtype’.
Cool. Would be nice to have some sharing options.
This article is very cool and very informative, I so know what is Stack Overflow Trends,,
thank you
http://www.livi.co.id
Cool!
It seems many tags are not available in the Trends tool. For example, I can see gdi+ but not gdi. I can see c and c++ but not pascal. I’m guessing there’s a minimal threshold of activity a tag must reach to be included. What’s the cutoff?
I’m curious to know this too. I was really curious to see how Alexa skills were doing, but didn’t see any alexa-related tag options. Looks like sotagtrends.com works for these tags, though…
How does this project relate to http://sotagtrends.com — at all?
I wrote sotagtrends.com independently. Looks like Stack Overflow just had the exact same idea
How about adding IDEs to the presets? 😉 https://insights.stackoverflow.com/trends?tags=intellij-idea%2Ceclipse%2Cvisual-studio%2Cnetbeans%2Cxcode
I would love to cut this data by page views and also region!
Hi, Can you add one more things into this analysis. Could you please
Q) Determine the Phases for technology Like Emerging->Growing->Established-> Decline. Can any body help me with Ideas for same. Its big challenge. I tried lots of method to do but failed.hope i will get some answers or hint
stack overflow is great for coding and jobs and problem solving
Is there a reason why I can’t compare “salt-stack” with “ansible”?
If the trends are measuring number of new questions posted per month/year with certain tag, I am wondering whether the natural cadence of the trend should be downwards after the initial peak, due to the fact that most questions will already be answered, so less new questions will be asked?
is that possible to show the actual number of questions instead of percentage?
Statistics is such a thing. Common sense suggests that more questions are asked about a technology on the increase. It could also mean a technology that matures causes less and less unclarity and hence less questions asked. Considering that one could argue on the basis of these figures that for instance using PHP-programners need less assistance as good sources are available and/or the language is getting easier to understand where Python, although being a bit longer around was not used very much and hence less resources for the novice are available yielding to many questions.
Number of questions asked might correlate with popularity but also with clarity.
What could be very interesting would be to have a filter by country because the results can vary drastically from one country to another.
It does not work with less-known tags.
Try “argo-workflows”, “luigi”, “spring-cloud-dataflow”, …