
Starting today, you can access the public data release for Stack Overflow's 2018 Developer Survey. Over 100,000 developers from around the world shared their opinions about everything from their favorite technologies to job preferences, and this data is now available for you to analyze yourself. This year, we are partnering with Kaggle to publish and highlight this dataset. This means you can access the data both here on our site and on Kaggle Datasets, and that on Kaggle, you can explore the dataset using Kernels. Kaggle is awarding two $1,000 awards over the next two weeks to authors of top Kernels on the Stack Overflow dataset. In this year's survey, we covered a few new topics ranging from artificial intelligence to ethics in coding. We also found, as we have in past years, that underrepresented groups in tech responded to our survey at even lower rates than we would expect from their participation in the workforce. There are 98,855 responses in this public data release. These responses are what we consider “qualified” for analytical purposes based on completion and time spent on the survey and included at least one non-PII question. Of the qualified responses, 67,441 completed the entire survey. There are many things we can learn from a large, rich dataset like this one, and we use this data throughout the year to explore questions about remote work to those about developer salaries to how to help companies hire or engage with developers. One issue we are exploring at Stack Overflow is how we can improve our site and community so that all our users feel welcome and included here. We asked several questions related to inclusion and friendliness, for tech in general and Stack Overflow in particular, including:
- Do you consider yourself a member of the Stack Overflow community?
- How frequently would you say you participate in Q&A on Stack Overflow?
- To what extent do you agree or disagree with each of the following statements?
- "I think of myself as competing with my peers"
- "I'm not as good at programming as most of my peers"
- "I feel a sense of kinship or connection to other developers"
Let's take a look at that first question, and see some of the types of insights we can draw from our survey. It is always important to keep in mind how online surveys like ours are fielded when interpreting them, i.e., we do not have a perfectly representative sample of the world's developers. However, a survey like ours still offers an enormous opportunity for learning about developers and the Stack Overflow community. For starters, let's think about how often someone participates on Stack Overflow and their feeling of belonging here, and how that interacts with what kind of developer they are.
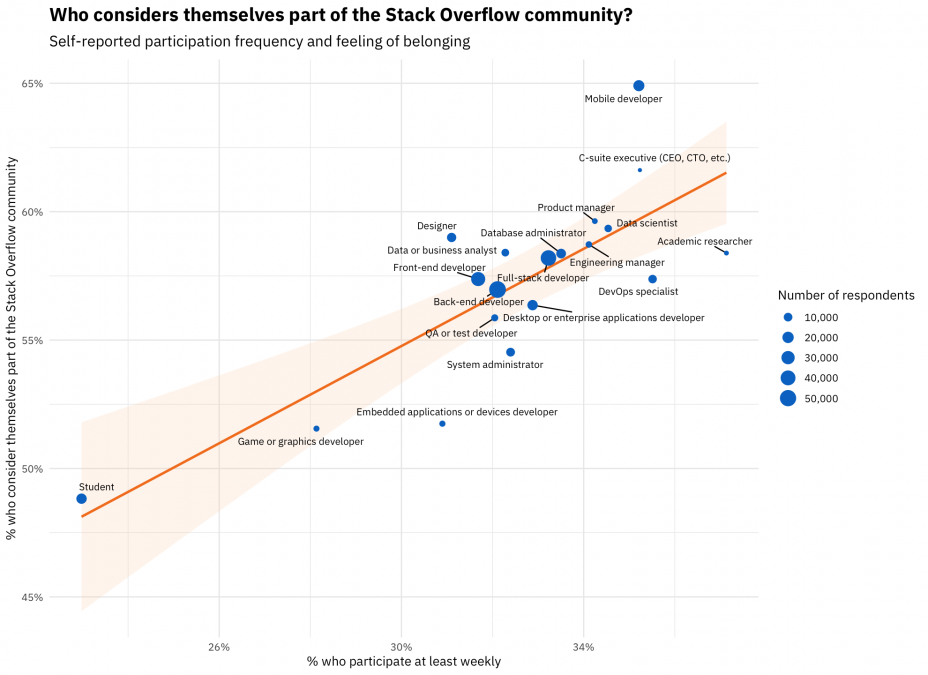
There is an upward trend in this plot, indicating that developers who say they participate more often also say they feel like they are part of our community at higher rates. This makes sense. But let's also look at how the different kinds of developers are distributed. Mobile developers are located high above the line in this plot, meaning they feel like they belong at Stack Overflow at high rates compared to how often they participate. That's good news for this group! Academic researchers report that they participate here on Stack Overflow at even higher rates than the group of mobile developers overall, but they feel like they belong here much less. Not so good news. Systems administrators, DevOps specialists, and developers working with embedded devices are other groups who do not feel part of the community here relative to how often they participate. This is information we are glad to have, because Stack Overflow is a community for all of these kinds of people and we can make decisions going forward to address this. We asked respondents what they studied (or are currently studying) as their undergraduate major. How is this related to feelings of belonging here at Stack Overflow?
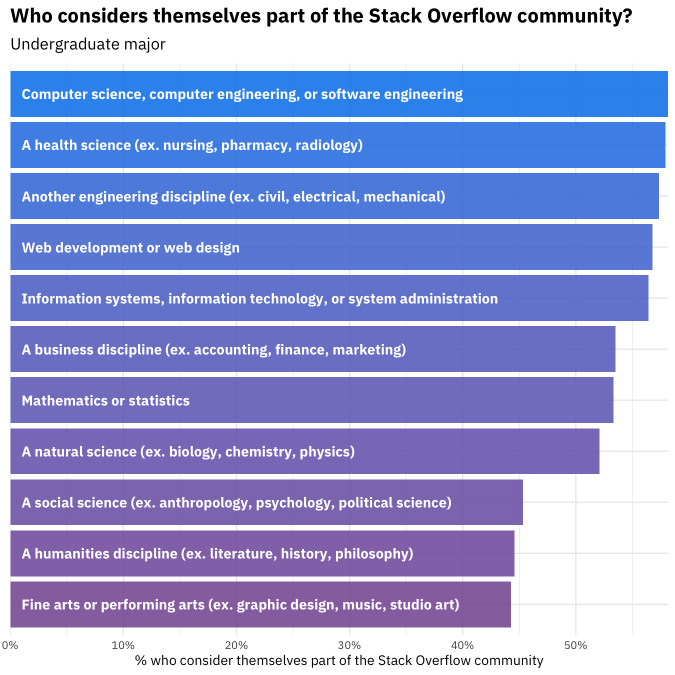
There are not noticeable differences between majors like computer science, other engineering disciplines, and web development. Health science majors are also in that top cluster of majors with the highest reported feelings of belonging. Developers who come from academic backgrounds in the humanities, fine arts, and social sciences are less likely to say they consider themselves part of our community. This is valuable information for us at Stack Overflow to keep in mind as we move forward, especially since the tech industry has so much to gain by learning from those coming from these fields. I've seen this for myself in data science; the influence of digital humanities and social science scholarship has been enormously important for responsible, ethical data science. What about gender and feeling like you belong here at Stack Overflow? Let's combine this question with years of coding experience.
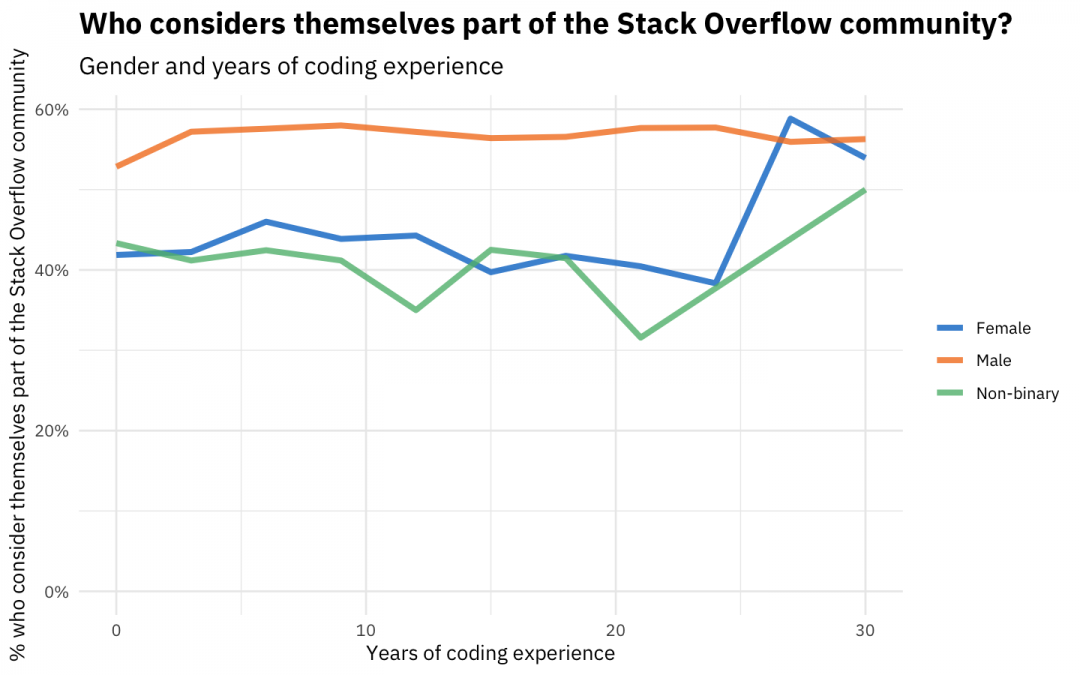
For men, there is no dramatic change in feeling of belonging with years of coding experience; men who are new to coding feel like they are part of the Stack Overflow community at the same rate as men who have many years of coding experience. Other groups say they belong here at Stack Overflow at lower rates overall, but they do exhibit some changes with experience. For example, women with the highest levels of coding experience (25 or more years) say they feel a part of Stack Overflow at about the same rate as men. The same is not true for women with less experience; the rates of identifying as part of the Stack Overflow community are about 15 percentage points lower. There are not many non-binary developers in our sample, but their answers exhibit about the same pattern as women. There could be lots of interesting reasons why we might find this kind of pattern (this may be a great example of survivorship bias) but this is again something that it is important for us and our community to know. If we want all kinds of users to experience Stack Overflow as a welcoming place, we need to see where that is less true right now. These are just three examples of how we can use this year's survey data to gain valuable insights into the developer community. I have put the R code for these analyses and graphs into a Kaggle Kernel here so you can see it for yourself. Want to dive into the results more deeply and see what you can learn about salaries or ethics or machine learning or diversity in tech? We look forward to seeing what you find! Remember that Kaggle will be awarding two $1,000 awards over the next two weeks for top Kernels for this dataset so take a look at the dataset and get started on your own analysis. Or as always you can share results on Meta using the [survey-2018] tag. Happy exploring!