Developer Salaries in 2018: Updating the Stack Overflow Salary Calculator
Today we launched the 2018 update to the Stack Overflow Salary Calculator, a tool that allows developers and employers to find typical salaries for the software industry based on experience level, location, education, and specific technologies.
The methodology we used is similar to last year, but this year we’ve added support for eight new countries and refined which technologies contribute to our salary predictions. Our salary calculator is based on the comprehensive data from the Stack Overflow Developer Survey, and the unprecedented number of responses we had this year has allowed us to build a more accurate model that applies to more developers across the world.
The inputs to our salary calculator, that we find most predictive of a developer’s salary, are your
- location,
- education,
- years of professional coding experience,
- what kind of developer you are, and
- the technologies you use professionally.
Geography
One of the biggest factors in how much developers are paid is where they live and work. Let’s look at salaries for the same five countries that we supported in last year’s version of the salary calculator.
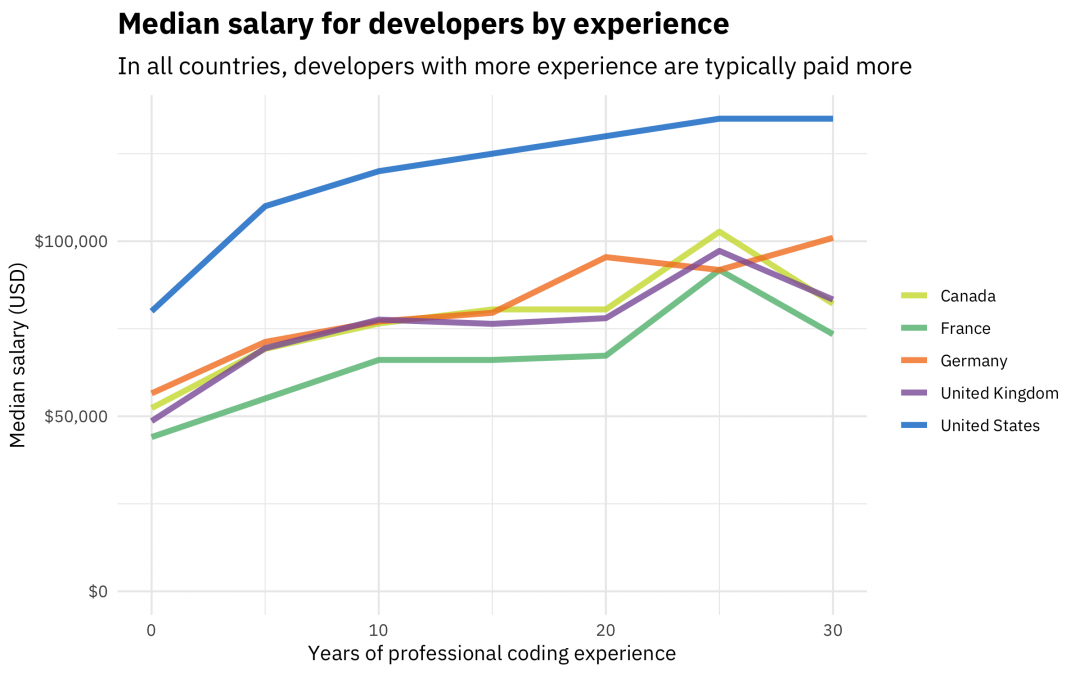
Have salaries changed from last year? According to our survey, developers are earning more overall, in all countries, with median salaries that are on average 25% higher than last year in locations such as London and San Francisco. Some of this increase is because we changed how we handled trimming the highest salaries from our dataset; we decided we were overzealous in trimming high salaries last year. While we are not saying that developers all over the world saw raises that big this past year, we do see evidence that developer salaries are increasing in all locations compared to last year.
In addition to these five countries, the comprehensive responses to this year’s survey have allowed us to build models that cover eight additional new countries:
- Australia
- Brazil
- India
- Netherlands
- Poland
- Russia
- Spain
- Sweden
Even within any given country, developer salaries can vary from city to city. In the UK, for example, our survey results indicate that developers in London earn over 20% more than developers in the rest of the UK. That being said, our dataset is not able to distinguish between cities that have around the average salary for any given country, to give individual predictions for all cities. To illustrate this, let’s look at the United States.
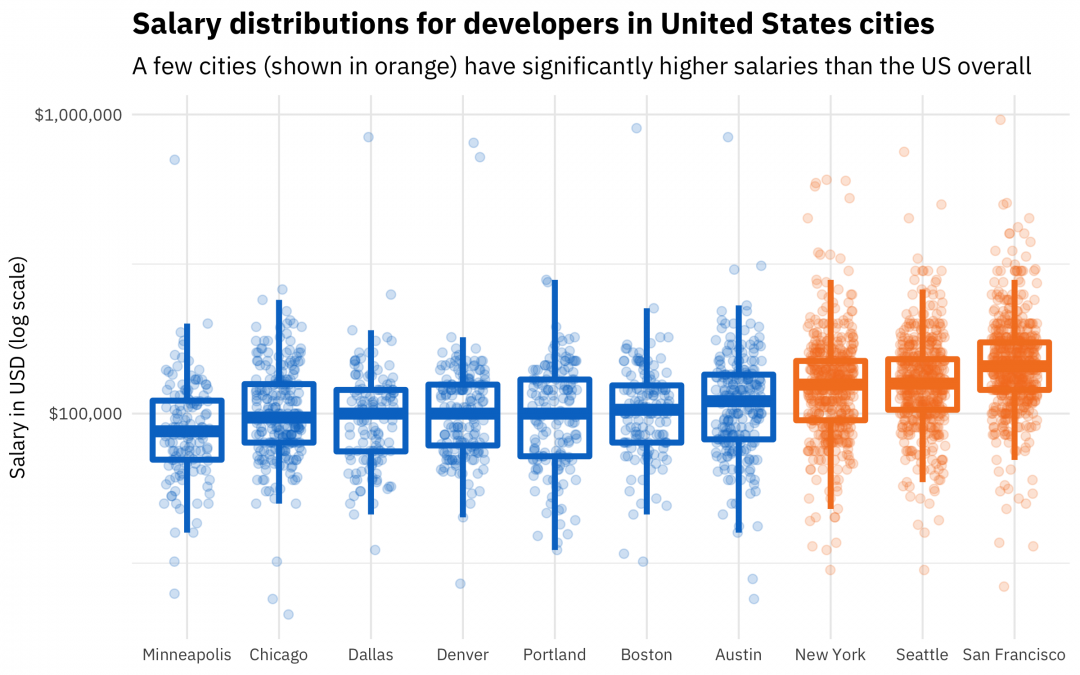
This plot shows the distribution of salaries in USD for the top 10 metro areas in the US by number of respondents. (Notice that the y-axis is on a log scale.) The cities are ordered from the lowest median salary (Minneapolis) to the highest median salary (the San Francisco area). Take a look at this graph and see how close together the median salaries for cities like Chicago, Dallas, Denver, Portland, Boston, and even Austin are. In our modeling, the data we have only supports a statistically different salary for the cities shown in orange. San Francisco, Seattle, and New York have developer salaries that are high enough compared to typical US norms and enough developers working there that we can confidently predict a different salary for a developer living in one of these cities than the US in general. For developers living in cities like Chicago or Boston, salaries are just about the same as what is typical for the US overall, so we can’t build a confident, separate prediction for each of these cities. You might look at this plot and wonder about cities with salaries that appear slightly lower like Minneapolis, but there we had fewer respondents, so again we can’t build a confident, separate prediction. In the US, we have individual city-level predictions for San Francisco, Seattle, and New York, and then a country-level prediction that covers the rest of the US. This same pattern holds true in other countries including France, Germany, and Canada, for the same reasons.
On our survey this year, we asked respondents what city they lived in via a free text field. We used standard text mining and data cleaning approaches to deal with this data, and included suburbs within larger metro areas. For example, the San Francisco Bay Area here includes respondents who said they live in San Jose, Mountain View, Sunnyvale, Oakland, etc., while Potsdam respondents are included in Berlin, and so forth.
Last year, we asked users to help us improve our salary calculator by confidentially sharing salary information with us in the calculator itself. This salary survey was 100% private and never appeared on any profile on our site or was shared with employers. We tried using this dataset to refine the salary calculator and build a better salary model, but it turned out that data collected in this way was less useful than our annual Developer Survey. The two main reasons were the geographical coverage we had and the number of responses. We want to send our thanks to every user who shared their data with us through the salary calculator; we appreciate your interest and trust. Since we won’t be using that data, we will stop collecting salary data through our salary calculator and we will delete the data we already have, according to our data policies.
Which types of developers make more money?
Another important factor that affects how much a developer is paid is what kind of work they do.
In all these countries, DevOps specialists are the top earners. We also often see the same handful of developer roles near the top vs. the bottom of the range in each country. In our annual survey, we expect to sample differently along the distributions of experience, education, developer role, and other characteristics. Do embedded developers make relatively more in Germany than the United States, or do they as a population have more experience there? Can the high salaries of data scientists be accounted for by high education levels alone? To account for this and make the most confident predictions for our users, we built a model for salary that accounts for all of these characteristics at once. In the end, some developer roles such as DevOps are associated with higher salaries, some developer roles such as QA are associated with lower salaries, and many are not associated with any change from baseline, i.e., from the typical developer salary in any given country.
The specific technologies that developers use also impact salary. This year, the technologies most associated with high salary include Go, Scala, Redis, and React. These are also some of the most loved technologies this year. As a data scientist, I would love to know how much of that relationship is causal, and which direction it goes in! Just like last year, some technologies like PHP are associated with lower salaries for developers, and some technologies like JavaScript are used so broadly that they do not affect salary up or down.
Building a model
We again this year used multiple linear regression to predict salary from the model inputs, with regularization to help with variable selection, (i.e. which of the many technologies and developer roles we asked about on the survey are important predictors for salary). The salaries are modeled on a log scale, because the salary distributions are log-normal (as such distributions often are) with a long tail of very high salaries.
In this salary calculator, we report a predicted salary for the location, education, experience, and other information you enter. We also report a 50% prediction interval. The specific statistical meaning of this interval is that we expect 50% of people with the same characteristics as you to have salaries within that range; it spans the 25th to 75th percentiles. The interval is just as important as the prediction itself (the 50th percentile), because it gives you an understanding of what the range of expected salaries could be.
This year, we built two models, one for countries with higher incomes and one for countries with lower incomes. We were able to achieve better salary predictions for developers in all countries with this approach, in terms of how well the models fit the data, compared to either building one model for all countries, building separate models for each country, or other approaches. One way we can evaluate how well a model fits data is to look at residuals, the differences between the predicted salaries and the known salaries for the dataset we used for modeling. Let’s look at the residuals for the countries and individual cities supported in the 2018 update to our salary calculator.
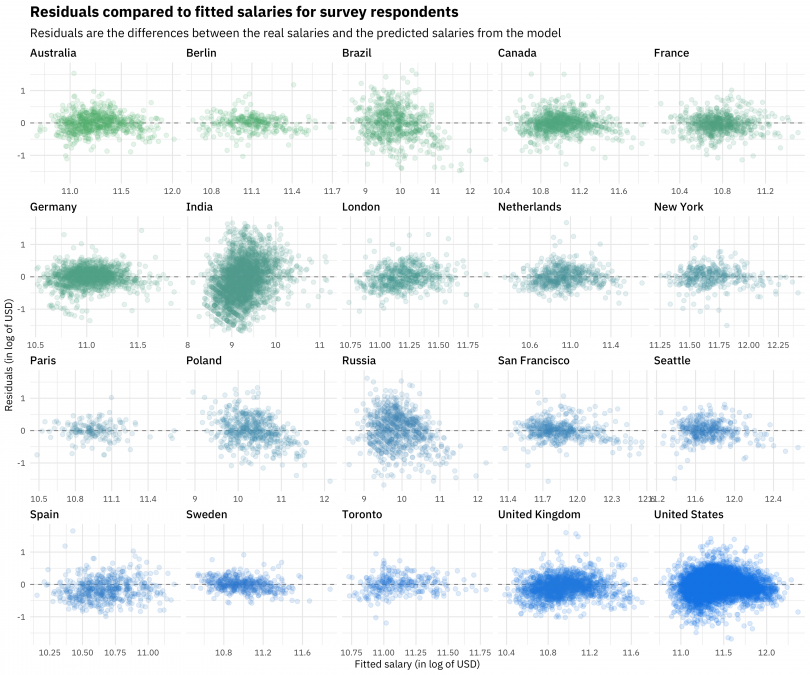
The residuals look pretty good overall, although there are a couple of things to notice and keep in mind. First of all, notice that the residuals are much higher for countries with lower incomes like India than countries with higher incomes like Sweden. We cannot predict incomes as accurately in countries with lower incomes. Second, notice the shape of the residuals for some countries such as the United States; there is less variation in the residuals at high salary than at low salary. Another way to say this is that the variance of the residuals isn’t constant, and this is called heteroscedasticity. It means that our dataset doesn’t quite meet the underlying assumptions of our model. In real life, developer salaries depend on both the characteristics we have taken into account in our model and other complex factors, some of which involve mild violations of the assumptions of our modeling. These are some of the limitations of our results, but the salaries and prediction intervals that we are reporting in our calculator this year offer reliable insight for developer salaries around the world.
This plot shows residuals and fitted salaries on a log scale, but salaries in the calculator itself are reported in natural units and the appropriate local currency for each user.
Try it out
Check out the Stack Overflow Salary Calculator and learn more about what developers are earning! As a developer, you can explore the range of potential salaries for your own background and technical skills, and find specific recommended jobs relevant for you. As an employer, you can learn more about the competitive marketplace for developers’ skills.
Questions? Comments? Head over to Meta now and use the salary-calculator
tag.
52 Comments
This appears to be broken on Android with mobile Chrome. I’ve filled out all of the fields, but unchecked checkboxes are bordered red after I tap the submit button. The submit button is enabled, but does nothing when I try to submit again. Some issue in the validation code?
Can you please submit this on meta with the [bug] tag? also, if you could include a screenshot that would be great. We haven’t been able to reproduce the issue so far.
Thanks!
I agree
This happened to me when I picked more than 5 check boxes in total. No error message to be found.
Does “salary” include stock bonuses?
No, we decided not include stock bonuses or to estimate them this year. Based on past years’ experience, it is rare for developers to accurately and consistently estimate the value of stock options or bonuses. We focused on gross salary, before taxes and deductions. This is a value that more developers across more geographical regions can estimate more accurately. However, it *is* a measure that doesn’t capture all developer compensation in all cases.
Did you not collect the data for total compensation, or just decide not to include it in analysis?
Excluding stock grants makes comparison much less useful for developers at large tech corporations, where a very large proportion of total compensation (as well as most of the variability in compensation between developers) comes in the form of stock grants.
If accurate estimates are the problem, why not just get income off of developers’ W2? In other words: ask them how much they actually made in the last year, not how much they think they will make. Something to think about next year?
“One way we can evaluate how well a model fits data is to look at residuals, the differences between the predicted salaries and the known salaries for the dataset we used for modeling.”
I thought the generally accepted approach is to use a portion of the dataset (say 75%) to build a model, then measure its accuracy against the remaining (25%) data. You can’t measure the accuracy of the model by applying it to the same data that built the model. That leads to over-fitting, right? Or do I misunderstand?
I used cross-validation with regularized regression for feature selection, which similarly reduces over-fitting for which features to use in a model like this one. It’s usually a good idea to look at the residuals overall to understand how a model is performing.
In the ‘residuals versus fitted salaries’ charts, are the values on the abscissa/ordinate the natural log of the salaries/residuals? If so, was there a particular reason for choosing ln, instead of log base-10?
Seems like base-10 log scales would be a lot more intuitive.
I’m really curious if this was like a “let’s just keep models simple and easy to explain to people” thing or if you really think this is the best we can do. Because the analysis feels very stats 101.
It would be very nice for the data to be cross referenced with costs of living, it might look like you’d earn twice as much by living in the states, yet the cost of living can be three or even four times higher for basic costs, effectively you might spend 80% of your income in US vs 60% of your income in UK
What is 25th percentile, 50th percentile, 75th percentile in results of salary calculator?
I tried the calculator, and got some numbered columns as a result.
But no mention of currency, so I can’t know how the result compares to my salary.
The currency + values should be at the top of each bar. If you think you are seeing something else, can you please submit a question on meta with the [bug] tag? If you can include a screenshot that would be great.
“developers in London earn over 20% more than developers in the rest of the UK” — I’m sure this is entirely the effect of @JonSkeet. :-p
“salaries in the calculator itself are reported in […] the appropriate local currency for each user”
A minor quibble: it doesn’t say that anywhere on the page. It would be good to specify it, specially for people using currencies that are close-ish to the dollar, so that the numbers are reasonable, but far enough to skew them, like Canada.
If you submit a location in Canada, you should get a salary prediction in CAD. If you are seeing another result, can you please submit a question on meta with the [bug] tag? If you can also include a screenshot, that would be great.
It might be a lot more intuitive if the drop down said something like:
* US – San Francisco
* US – Seattle
* US – New York City
* US – National Average
instead of giving the impression that your location matters more specifically.
Those of us in smaller cities were discussing the results and thinking, “HEY, are we REALLY that underpaid!”
Now that we read this though, we see that “Our Small Town” and Chicago and Austin are “the same”, which explains why this calculator seems crazy.
Have you ever thought about including the gender as a feature?
Sadly, there still a lot of difference in the salary, and the percentage of difference varies according the country (sometimes).
So that employers can continue to differentiate salaries based on gender? I don’t think so. Believe me, such things only promote inequality.
Please add Vue.js as a framework!
Hi Julia Silge,
Thank you for adding India in your list.
India is the lowest salary compare to other countries.
Good question. I would like to know what the number would be if I were to work as a 1099 corp to corp.
Does the calculated salary include salary and benefits or is it salary only? And I don’t mean bonuses.
The calculator seems _way_ off for me. The years of experience multiplier seems to be the biggest contributor. When I put in 30 years, the 75th percentile is nearly double my salary, and I’m pretty sure I’m currently in the top 5-10 percent in my area.
Even when I drop my experience down to 20 years, the numbers are still off by 40% or so for the median. If I was in the 75th percentile I’d be able to put a Ferrari in my garage without thinking twice about the payments.
interesting. perhaps it’s extrapolating past the bounds of the original data and or it gets really thin at 30 years experience.
I see the question and response that salary does not include stock bonuses, but does it include cash bonuses?
People in the US seem to be way overpaid, then again cities are probably skewing the data way high or there just isn’t a whole lot of survey data. Would be nice to see the raw data.
For example, I find it difficult to justify spending near 100k on a developer with 2-3 years experience unless its in a large city where the cost of living is high.
This salary data is not a valid assessment. The salary range for the US seems to be based on the region you live in, as in the “Mid-West region”. So the salary is the same for Chicago, IL, Peoria, IL, and Dallas TX, but should not be so. This is very misleading.
The actual salary differs in these areas based on cost of living. A $100,000 salary in Chicago, IL is comparable to $75,654 in Peoria, IL (source: https://www.bestplaces.net/cost-of-living/chicago-il/peoria-il/100000), and $85,843 in Dallas TX (source: https://www.bestplaces.net/cost-of-living/chicago-il/dallas-tx/100000).
Good evening Julia Silge,
Thanks for this tool and study.
But there is a BIG MATHEMATICAL MISTAKE in your comparisation study.
When you display for the same developer (experience, study) a $90 000 in France versus a $150 000 salary in USA.
As a developer when you are paid 90 000$ in France you receive almost 100% more to this salary PAID by your employer in benefits (Retirement, Healthcare, Unemployment insurrance…).
So the real world comparaison would be 90 000 + 90 000 = $180 000 that compares to the $150 000 in US.
Let say another way, if you are the employer your developer cost is $180 000 in France and $150 000 in US.
My point is to say compare an orange with an orange (compare the same things).
Best regards,
Eric
Employers in the USA also pay for retirement, healthcare, unemployment insurance, etc; so I don’t think the comparison is really that far off.
However, I do think the study could do a better job to get at some form of “total compensation”. Benefits are indeed one part of that picture, but even bigger is stock and bonus compensation which can easily be 50% or more of a developer’s total compensation.
Hi,
I agree but the fact that the “total compensation” include mandatory benefits in Europ should lead the study to include them. If you read the SO study you would think you would earn the double in USA. In reality you earn more in France, Germany etc ….
I was going to make this point a little differently.
When you ask a person in the US what their salary is, they will naturally give you a PRE-tax amount. When you ask someone in Europe, they will give you a POST-tax amount. (I’m not certain how, say an Australian or an Indian would respond or think of their salary).
The big differences in salary that you’re seeing between the US and Europe almost certainly are mostly a reflection of that. The American’s take-home salary is actually 35-45% below what they’re saying (after accounting for federal and state taxes and social security/medicare), whereas for the European, their 40-55% tax/social security take has already been removed.
You’re sure about the POST-tax amount for Europe? In Germany I’d say only 1 in 10 will tell you his/her net income (after taxes etc.), and anyone else will ask to provide PRE-tax numbers immediately in my experience. POST-tax amount is subjective because of different aspects of the individual so not comparable.
I think it’s a good point, but it’s really hard to calculate the salary benefits as they vary between all euro countries.
And like someone said below in the USA there are benefits too.
“system administrator, moscow, russia, 2 years experience, less than a bachelors, php, linux, windows, windows-server, wordpress” query suggested me a 910000 RUR yearly salary or about 75833 RUR per month in 75% of cases. But it is some like a dream, and popular local job search engines can find only about 50…65k RUR jobs.
When I am selecting “bachelors degree (eg ba, bs)” (meaning that I have something higher than a common school level), the Salary Calculator said that my salary should be 1,120,000 RUR (about 93k RUR per month). But such salary is almost impossible in 2018 year, and most of employers can pay no more than 65k RUR (check via hh.ru or something similar), otherwise they simply changing the System Administrator to someone who doesn’t want bigger salary. Probably, if work at multiple companies at same time, the salary will be more like said by Stackoverflow Salary Calculator, but it is not official and fully legal way. Some companies can pay approx. 20k RUR per month (approx. $400), and no more, so in such cases multiple jobs at same time are requirement to pay for home and food. And this is not a very rare case.
Calculation algorithms for Russia are not yet perfect.
I’m living in São Paulo, Brazil. I tried the salary calculator and the results were laughable, completely unrelated to the local reality and way more higher than what any employer is willing to pay. I’m afraid that your data set in this region is too poor, skewed or polluted or that you are overestimating the weight of some input.
Further, it is not clear if this is a monthly salary or an yearly salary. Here in Brazil, everybody refers to salary as a monthly value, but this is not true everywhere. I presume that it is yearly, otherwise, the value would simply not make any sense. Anyway, it should be made clear to avoid confusion and misinterpretation. Also, to avoid confusion and misinterpretation, it would be a nice idea to explicitly add the currency used.
I’m living in São Paulo, Brazil. I tried the salary calculator and the results were laughable, completely unrelated to the local reality and way more higher than what any employer is willing to pay. I’m afraid that your data set in this region is too poor, skewed or polluted or that you are overestimating the weight of some input.
Further, it is not clear if this is a monthly salary or an yearly salary. Here in Brazil, everybody refers to salary as a monthly value, but this is not true everywhere. I presume that it is yearly, otherwise, the value would simply not make any sense. Anyway, it should be made clear to avoid confusion and misinterpretation.
It would be nice to have data for application security engineers, feels like that’s a collective left out.
Adding skills can diminish predicted salary. How is that possible? For example: having a skill set of SQL and R gives a predicted median of $110,000. Keeping everything else the same (location, years experience, etc), ADDING an additional skill (eg. sql-server) will LOWER the expected salary. I can see why this might occur from a statistical point of view, but from a real-world experience perspective it doesn’t make sense, therefore the modelling is misleading.
One thing I find weird and unexpected is that some technologies lead to a subtraction of predicted salary e.g., php and mysql. Apparently, they’re even worse than nothing. Is this a bug or is there an explanation behind this behavior?
What happens to people who are proficient in nearly all the technologies listed? Should they take the calculator multiple times checking 5 at a time until they get through them all, then average the salary results together to get an accurate estimate? Why only 5? I didn’t see that addressed anywhere.
Basing on your calculator we will earn much more if we know just two technologies for example:
javascript + shell
If we learn something extra, for example:
javascript + shell + HTML
then you will earn less money…
This is somehow funny for me;)
Does it normal that the calculus does not make any differences between one profile with Graduate degree and another one with Post-grad degree ?
Are all figures in USD? For example, when give information for a city in canada, is it giving me USD or CAD?
Furthermore, when you collected the data, did you make a distinction between CAD and USD?
Guys, as you know my location (so you know this is not applicable to me as I’m in Japan) please don’t show a popup for this feature.
What’s the point in taking me to that page, me filling that form, and then you telling me you don’t have data for Japan. :thumbsdown:
I’m wondering if this calculation of salary includes both salary and benefits or salary only. As you stated above in the comments stock bonuses is not counted but how about other kind of benefits?
Wages are growing in parallel in all countries. This is the right trend. Does this algorithm take a variety of bonuses or overtime?
India has the best developers and their salaries are less competitive in the comparison
Really Informative Blogs, I love this blog site.
Excuse me, you’re talking about monthly or annual salary.