Last month, we published the results from Stack Overflow’s 2019 Developer Survey, and today you can access the data from this year’s survey for yourself. Almost 90,000 developers from around the world shared their opinions about the jobs they have, the technologies they use everyday, and where they see the industry going. This year, we are partnering with Glitch to publish and highlight this data. This means you can access the data here on our site, and you can explore the dataset on Glitch. You can even remix the Glitch app to answer the questions you are most interested in!
Glitch is a friendly community where people build cool, inspiring, useful apps and sites. Once a project is live, it’s easy for anyone to see the code and remix it for themselves.. The Glitch team built apps to highlight aggregated and summarized results for our April release of the 2019 Developer Survey, and this new app presents a way for users to explore the data more deeply. The Glitch app uses Datasette as its engine for exploring and publishing this year’s Developer Survey results. It’s a tool aimed at data journalists, museum curators, and others with data they want to share with the world.
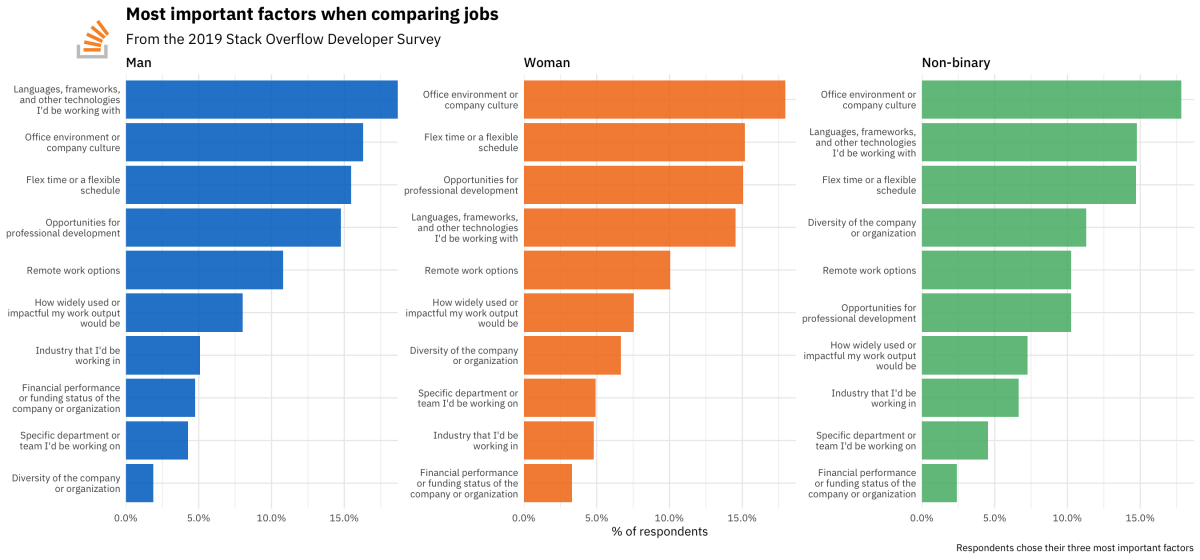
There are 88,883 responses in this public data release; this is the number of responses we consider “qualified” for analytical purposes based on time spent on the full, completed survey. One question we covered this year was about important job factors for people who code. We asked respondents to picture themselves comparing two jobs with the same compensation, benefits, and location, and consider which characteristics would most influence their choice between the two. We find that different types of developers apply different sets of priorities when considering jobs. Developers who belong to gender minorities in tech rank the office environment and company culture as their highest concern when assessing a new job, and are more likely to say the diversity of an organization is a top concern for them.
We can learn a lot from the main published report for this year’s survey, as well as all the supporting analyses we do, but nothing replaces being able to investigate the data for yourself. The Glitch team built an app that contains the entire public data release in its back end, and designed a way for you as the user to create “questions” (i.e. queries) to examine the data in exactly the way you want to. Now, if you are interested in what priorities people who code bring to considering jobs, you can interactively explore that question with many specific parameters.
Glitch focused on questions like job priorities and satisfaction in this app, but you can remix the app and use it as a jumping off point to explore a myriad of other questions. What do you want to learn from this year’s results?
- Are education level and job (or career) satisfaction related?
- What are the pros and cons of remote work?
- Are people in tech overworked? Specifically who, and how much?
We look forward to seeing what you build or discover using the public data release of the 2019 Stack Overflow Developer Survey. Share yours with the world using the hashtag #DevSurvey2019. Happy exploring!