We’ve all heard the saying, “You can’t manage what you don’t measure.” This is true in every facet of life, but especially when it comes to managing teams and the resources they use to get the job done. But building custom reports takes time, and canned measurements don’t always give you the data that you need. So how do managers ensure that the solution is not worse than the problem?
Enter the new and improved Dashboard on Stack Overflow for Teams, your go-to tool for viewing all of the most critical metrics that can be used to gain insight into several areas with improved customization.
We’re excited to share that this tool is available immediately for Business plan customers for Stack Overflow for Teams. A release for Enterprise customers is coming soon.
What the new and improved Dashboard does
The existing Dashboard can help answer questions such as:
- What’s the overall health and activity of your community?
- Who are the top contributors inside your organization?
- How much time are your engineers saving when looking for answers or technical information?
- How successful are your internal marketing strategies at driving engagement?
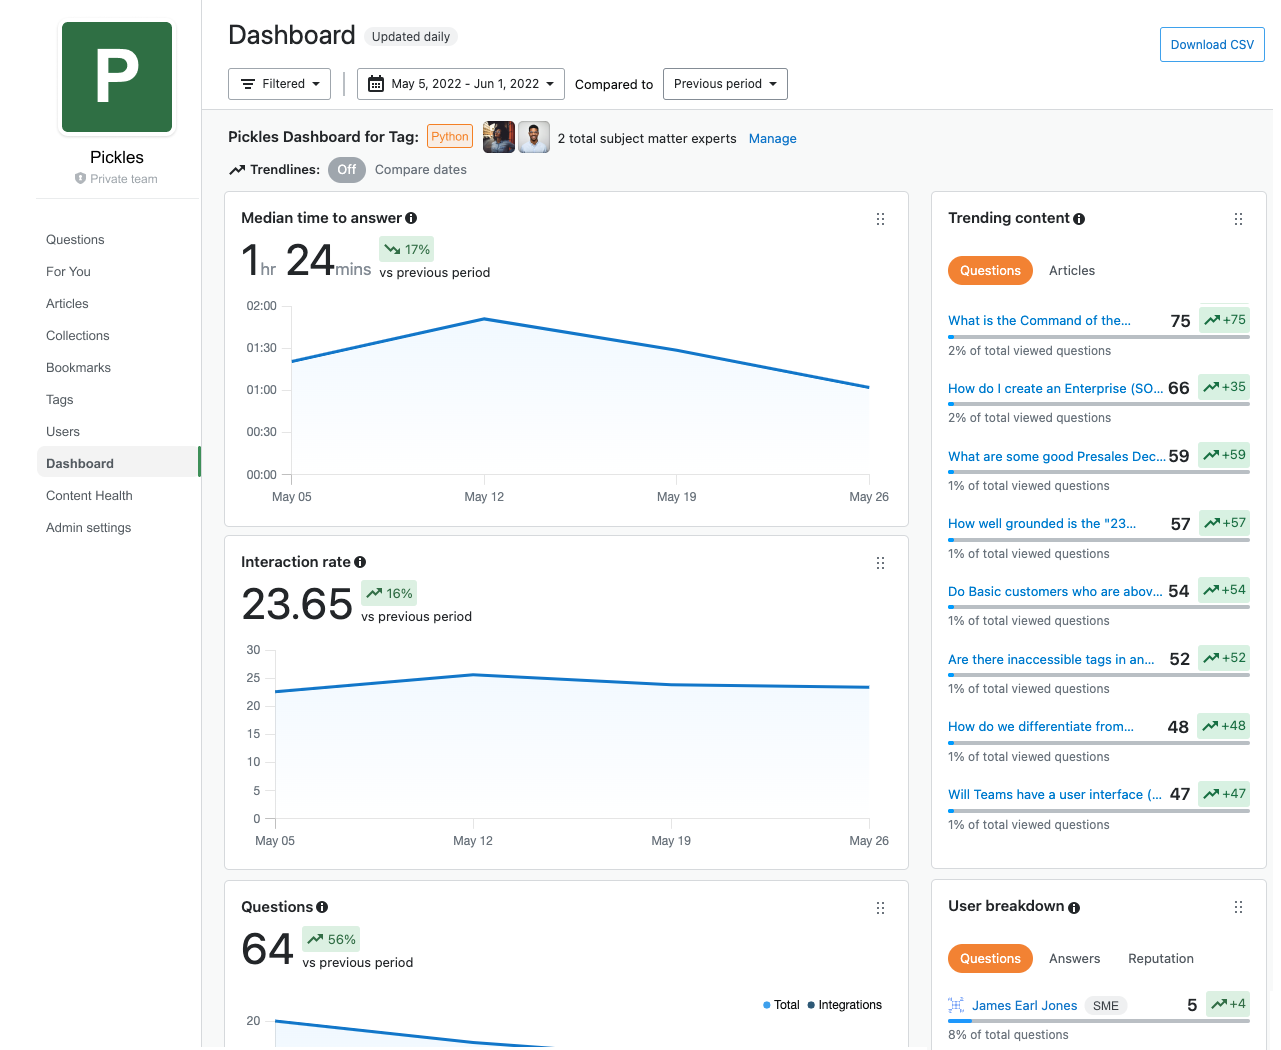
The new and improved Dashboard builds upon existing features to offer organizations even more insight into how their workforce is utilizing Stack Overflow for Teams.
Filter by Tag: Users will now have the ability to filter engagement metrics by tag, allowing them to see the breakdown of new questions, new answers, median time to answer, answer ratio, edits, interaction rate, trending content, and user breakdown by the specific tag they select. All users will be able to download the tag-filtered metrics in a CSV file.
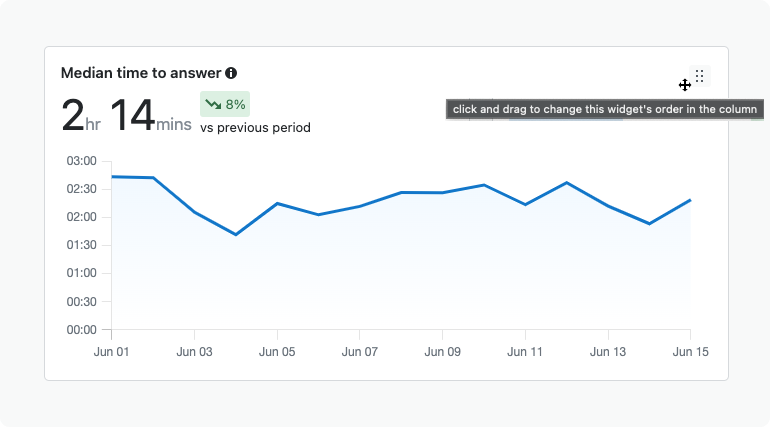
Trendlines: Benchmarks & Compare Dates: This feature allows users to track engagement over a specified time period and against a defined benchmark set by administrators. The available benchmark metrics include interaction rate, median time to answer, questions, answer ratio, and active unique visitors. Reviewing these metrics regularly allows administrators to proactively get ahead of any drops in engagement and kick-off action plans, such as “Stack-a-thons,” to get their community back on track.
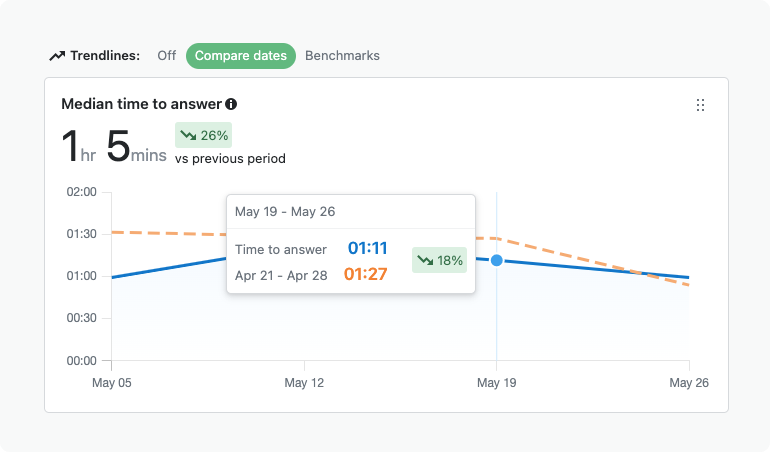
Track engagement over time
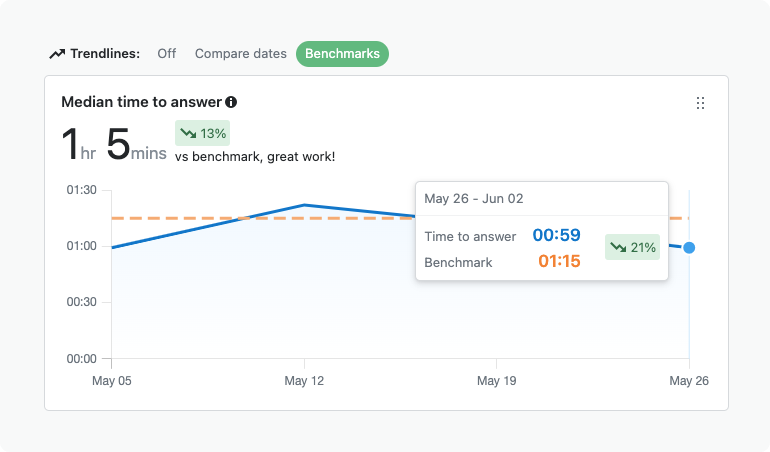
Track engagement against a defined benchmark
Trending Insights: The trending feature gives users a more holistic view into how Teams is being utilized within their organization. What tags are being utilized more or less? What questions and articles have been viewed the most? What does this information mean in terms of focus areas for your organization? You can use these insights to understand where your organization has potential knowledge gaps, friction points, or opportunities to provide focused training.
Integration Insights: Integration Insights allows administrators to see how users are engaging with Stack Overflow for Teams from integrated chat applications. Out of all your new questions and answers, how many of those were asked from the application and how many were asked and answered via Slack or Microsoft Teams? Chat applications can hide a lot of friction points - with the new dashboard, you can uncover the scale of frictions that may be happening outside the Stack Overflow for Teams platform.
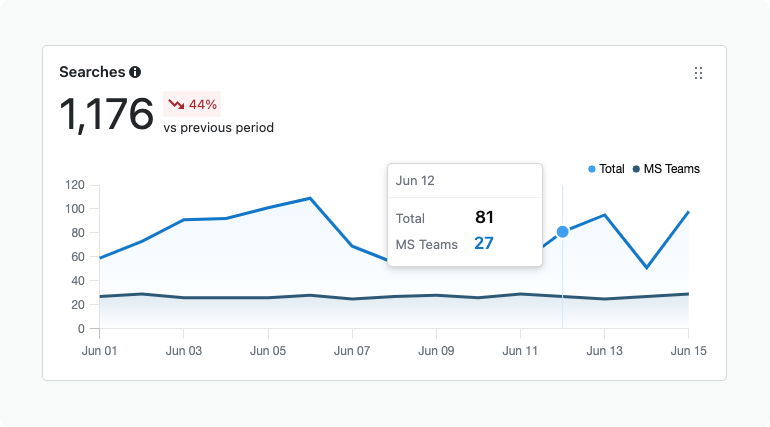
Trending searches comparison
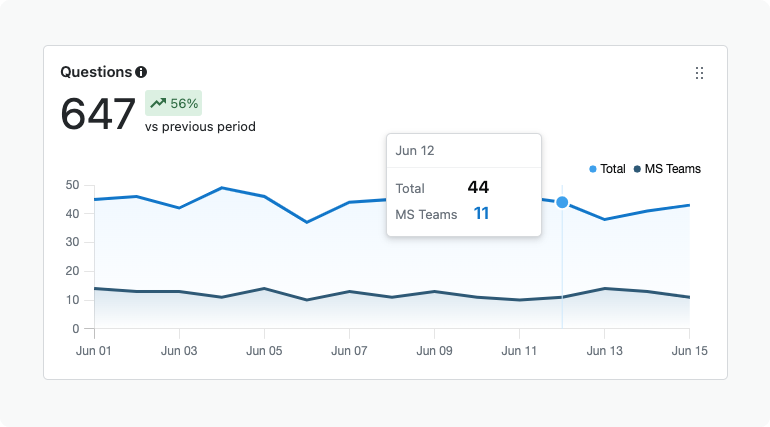
Trending questions comparison
If you don’t have these integrations installed yet, your Stack Overflow for Teams administrator can install the Slack or Microsoft Teams integration for your organization.
Personalized Dashboards: The new and improved dashboard features customization that allows users to drag and drop their metrics in the layout that best serves their needs. Each users’ view is automatically saved after every move, storing their new default view.
In conclusion…
The new and improved Dashboard is now available to Business plan customers for Stack Overflow for Teams, and coming soon to Enterprise customers. We can't wait for our customers to see the value that this new customizable dashboard will add to their organizations.
Want to learn more or upgrade? Contact us today.