
Kafka enables real-time data processing and movement across distributed systems, supporting use cases such as log aggregation, messaging, event sourcing, and data integration.
However, managing costs while maintaining Kafka's performance and reliability can be challenging due to its complex architecture, the need for high throughput and low latency, and the substantial storage and computational resources required. Balancing these factors demands careful planning and optimization to ensure efficient operation without escalating expenses. In this article, we’ll explain what drives Kafka costs and walk you through how to set up the most cost-efficient Kafka clusters for your use cases.
First, understand your cost drivers
Much of Kafka's costs come from the underlying costs of the supporting computing infrastructure. If you can manage the drivers of that resource consumption, you can lower your overall costs. Here's a breakdown of some key elements that drive Kafka costs:
- Compute: The number of brokers and their types (CPUxMemory).
- Data transfer: Charges are based on the amount of data transferred in and out of Kafka clusters. In the public cloud, where your application resides, providers charge for data transfer based on volume, source, and destination. Egress (read) costs are a significant consideration, especially for large volumes of data (usually the case when it comes to solutions like Kafka).
- Storage: The storage capacity required to meet the retention requirements.
An example of Aiven’s Kafka pricing plans:

As your workload scales and requires more brokers/CPUs/RAM/storage, so does the plan your Kafka cluster requires.
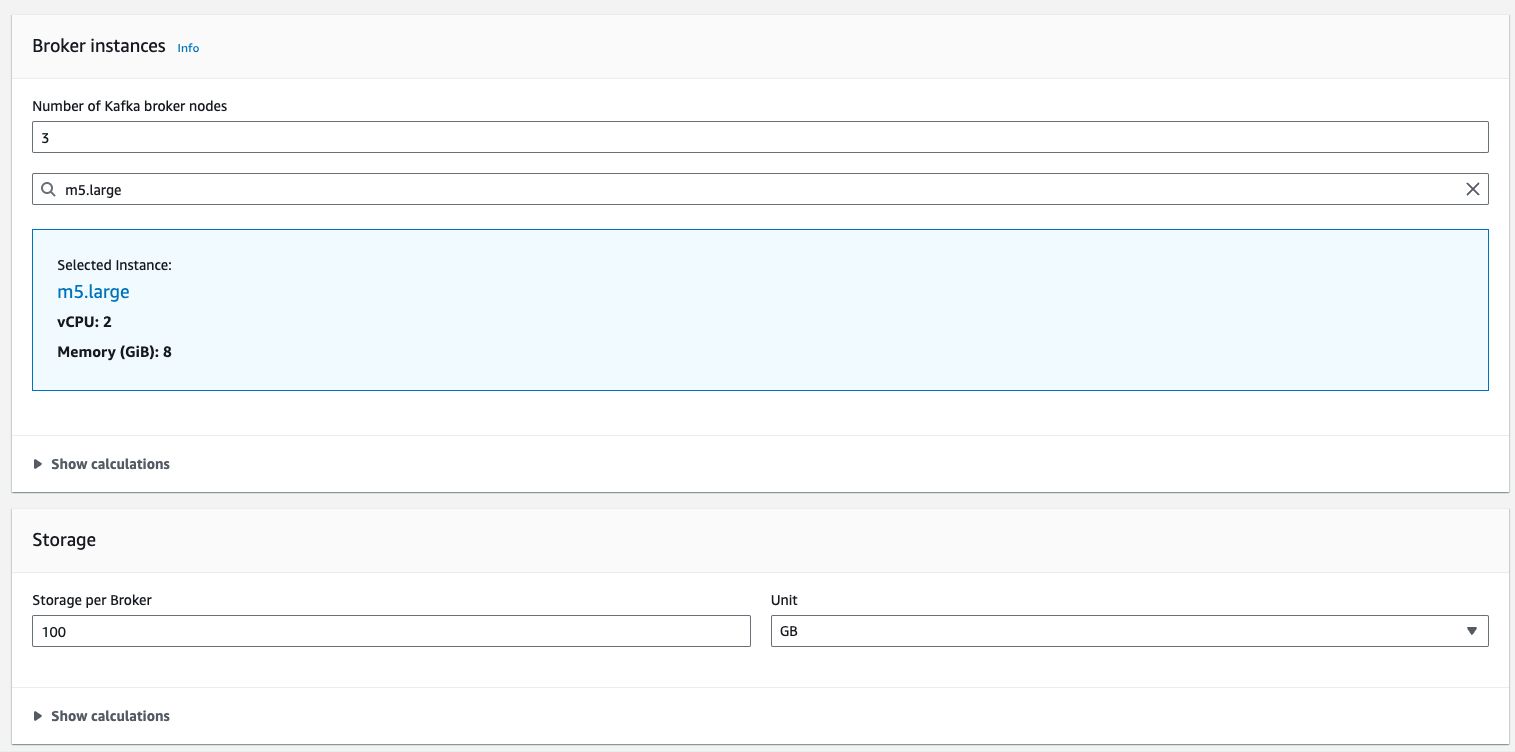
An example of AWS MSK calculation factors:
Costs and Apache Kafka
Since Kafka is open-source software managed by the Apache Foundation, you can download it and install it for free. However, you’ll likely want to install it into a high-capacity, highly available cluster, probably on a cloud instance. Many cloud providers provide a managed Kafka, and each has its own cost structure. There are three deployment types: serverless, hosted, and self-hosted, and each has unique cost implications.
Serverless:
- A turn-key solution. The vendor is in charge of keeping the cluster alive, secure, scaleable, including most of the lifecycle-related management. The infrastructure layer is completely transparent to the user.
- Usage-based pricing.
- Usually takes under account the number of partitions, traffic, storage, and operating hours.
Hosted:
- The application deployment, lifecycle management, security, and monitoring are managed by the vendor.
- Gives the user more freedom but also increases risk and operational burden as the user is required to manage both the application and certain aspects of the infrastructure.
- Standard server costs: hours, traffic, storage, number of vCPUs, and amount of memory.
Self-hosted:
- The user is in charge of every aspect of the cluster, from infrastructure to the application itself.
- Common deployment type in high-velocity, secured, and regulated environments where a dedicated infrastructure is required for both performance and a higher level of elasticity.
- Self-hosted can be cost-efficient in two scenarios: very small scale or very big (huge) scale, where the margins taken by the vendor are significant. A quick tip: take the fast track and ask yourself in advance if there is a correlation between business outcomes and the scale of our Kafka.
Why cost-efficiency over cost reduction?
Kafka is a dynamic server with highly variable workloads. Smaller environments (processing a few megabytes per second) may not have the same requirements as large environments for efficient usage. However, managing fluctuations between low and high peaks is crucial in large-scale streaming environments. The Kafka environment must efficiently absorb these variations.
Reducing costs isn’t a matter of one-time fixes; it’s a continuous process. As demand scales, your Kafka cluster will need more computing resources. If you can configure your clusters to operate in a cost-efficient manner, you can ensure dynamic demand never breaks the bank. Cost reduction is actually the outcome of being cost-efficient.
Achieving cost-efficiency in high-volatility environments is essential for lowering overall costs. To do this effectively, some key actions must be taken:
- Continuously optimize: It starts by eliminating inactive resources like topics, idle consumer groups, and idle connections. These resources consume valuable resources from your cluster, contribute to CPU, Memory, and storage utilization, and increase rebalances. If they are not needed, you should eliminate them.
- Shrink your payload: Enable client-level compression and use more efficient data formats like Avro or Protobuf. The last one does require a certain curve, but once implemented, your CFO will feel the savings, and your application will strive.
- Avoid the default: Continuously fine-tune your brokers to match your current workload by updating its num.network.threads and num.io.threads. There is no one-size-fits-all configuration. You should iterate and experiment. Finding the sweet spot of both will increase your cluster throughput and responsiveness without adding more hardware, which will increase your spending.
- Adopt dynamic sizing: Shift from static to dynamic resource allocation. Ensure your Kafka clusters use only the necessary hardware/resources at any given moment.
Let’s get to work.
Hopefully, we’ve got you on board for cost-efficient Kafka clusters. But to get the benefits in the real world, you’ll need to commit to the work required. Below, we lay out exactly what you should be doing to make sure your Kafka clusters run efficiently.
Continuous optimization
An efficient Kafka cluster needs to be constantly adjusted so that you are using only the resources that are required now. Cluster loads will change over time, so what makes it efficient will change as well. The tasks below should be performed regularly based on constant monitoring.
- Identify and reduce inactive topics and partitions. Inactive topics mean topics that have not been accessed in a certain amount of time. Each implementation has its own business logic. To safely mark a topic as inactive, you need to monitor each topic over enough time (based on your environment knowledge) to ensure no consumer groups periodically consume data from these topics beyond the time window that you defined as enough to declare inactivity.Now that we have identified the topics and partitions to be reduced, let’s fix it. We have three options for how to do that:
- Option 1: Delete: This is an irreversible action, but the best one for generating significant savings. Think about it like image compression. You have different levels of compression, and each can affect the image differently. The higher the ratio, the lower the quality of the image. In this case, deletion will provide the most savings, but at the same time, it increases the risk of harming some applications or use cases.
- Option 2: Recreate: When deleting a topic, there are two risks. First, an application might try to access that topic, and if its exceptions are not handled properly, it will crash. Second, an application might not crash but does expect the deleted data. Recreation is about recreating a topic to at least avoid the first scenario.
- Option 3: Archiving: Consider archiving the data to cheaper storage solutions instead of deleting inactive topics and partitions. This ensures data retention policies are met without incurring high costs.
- Identify and reduce inactive connections.
- Connection tracking: Track all active and inactive connections in real time. This helps identify stale connections that can be safely terminated.
- Connection limits: Configure connection limits to prevent excessive resource consumption by inactive connections. This ensures that only necessary connections are maintained.
- Timeout settings: Adjust timeout settings to automatically close connections that have been inactive for a specified period. This reduces the burden on resources and improves overall system efficiency.
- Identify and reduce inactive consumer groups.
- Regular audits: Conduct regular audits of consumer groups to identify those that are inactive. Inactive consumer groups can cause up to 40% more partition rebalances, impacting performance.
- Usage metrics: Track usage metrics like offset movement over time to understand activity by certain consumer groups. This data can guide decisions on consolidating or removing inactive groups. If consumers rely on the state of a deleted consumer group, they will recreate the group and read offsets based on their configuration, which might start from the earliest message.
- Automated management: Implement automated processes to manage consumer groups based on their activity levels, ensuring resources are allocated efficiently and cost-effectively.
- Compress data sent from producers.
- Compression algorithms: Evaluate different compression algorithms (such as GZIP, Snappy, or LZ4) to determine which provides the best balance between compression ratio and performance for your workload.
- Evaluate algorithms:
- Performance testing: Conduct performance testing to measure the impact of compression on both data size and system performance. This ensures that the chosen compression method does not adversely affect system throughput.
- Ongoing assessment: Periodically reassess compression settings to ensure they remain optimal as data patterns and workload characteristics evolve over time.
- Non-binary payloads.
- Data format conversion: Serialize non-binary payloads (such as JSON or XML) to binary formats (such as Avro or Protocol Buffers) to reduce data size and improve transmission efficiency.
- Payload optimization: Implement payload optimization techniques, such as removing unnecessary metadata or using more efficient serialization methods, to further decrease data size.
- Education and training: Educate developers and data engineers on the benefits of using binary formats and best practices for payload optimization. This ensures consistent implementation across the organization.
Shrink your payload
There are two main recommended ways to shrink your payload without “paying” valuable cluster resources: client-level compression and the use of binary payload instead of non-binary (JSON). Choosing and implementing even one of them can greatly impact your traffic costs, as well as storage and overall throughput.
Client-level compression
Kafka supports several compression codecs that you can use to reduce the size of your messages. The common compression types supported by Kafka include:
- GZIP: A popular compression algorithm that offers a good balance between compression ratio and speed. It's widely used and supported by many tools.
- Snappy: A fast compression algorithm with moderate compression ratios, designed for speed. It's a good choice when low latency is critical.
- LZ4: Another fast compression algorithm, similar to Snappy but often faster in decompression. It’s suitable for scenarios where both high speed and reasonable compression ratios are needed.
- ZSTD: A newer compression algorithm that offers high compression ratios and speed, making it a good choice for scenarios where maximizing storage savings is crucial.
To enable compression at the producer level, the compression.type parameter needs to be set with one of the algorithms above. Since Kafka 3.8, you can also tune the compression algorithm level and gain higher ratios when correctly match with the producer workload (mainly message size).
No JSONs. Use binary formats
Payload serialization using Protobuf or Avro is typically employed to enhance data quality and governance. However, it also plays a significant role in reducing data size while offering a more CPU- and memory-efficient deserialization process compared to traditional decompression methods. Implementing these serialization formats does come with a learning curve and requires managing an additional component, like a Schema Registry, to handle and maintain schemas. But once this is set up, you can expect a smooth and reliable operation moving forward. A good sense for the potential outcomes can be found here.
Avoid the default
It all depends on your scale. As with any other application, default parameters were created to offer a turnkey solution for the most common use cases to achieve a quicker onboarding process without too much hassle. Specifically in Kafka, understanding and tuning the different buffers and timers can significantly impact your entire cluster behavior in serving much more data.
These are the most important properties to “avoid using the default”:
1. Broker Configuration
- num.partitions: Defines the default number of partitions per topic. Adjusting this can improve parallelism and throughput.
- log.retention.hours / log.retention.bytes: Controls how long data is retained on the broker. Tuning these can help manage storage utilization.
- log.segment.bytes: Determines the size of each log segment file on disk. Smaller segments can lead to more frequent log cleanup but can improve recovery time after a failure.
- log.cleaner.enable: Enabling this allows for compacted topics, which helps reduce the amount of disk space used by topics with keyed data.
2. Producer Configuration
- compression.type: Configures the compression algorithm for the producer. Options include gzip, snappy, lz4, and zstd. Choosing the right compression can reduce payload size and improve throughput.
- acks: Determines the level of acknowledgment the producer requires from the broker. acks=all ensures data durability but can increase latency, while acks=1 or acks=0 can reduce latency but at the cost of potential data loss.
- batch.size: Controls the maximum size of a batch of messages. Larger batch sizes can improve throughput but may increase latency.
- linger.ms: Introduces a small delay before sending batches, allowing more records to accumulate in a batch. This can improve throughput but might increase latency.
- retries: Configures the number of retry attempts when a request fails. Higher retry counts can improve reliability but increase producer latency.
3. Consumer Configuration
- fetch.min.bytes: Specifies the minimum amount of data the broker should send to the consumer in a fetch request. Increasing this can reduce the number of fetch requests but may increase latency.
- fetch.max.wait.ms: Controls the maximum time the broker will wait before sending data to the consumer. Tuning this alongside fetch.min.bytes can balance throughput and latency.
- max.poll.records: Limits the number of records returned in a single poll request. Adjusting this can help with memory management and processing speed on the consumer side.
- session.timeout.ms: Determines how long the consumer can go without sending a heartbeat to the broker before it is considered dead. Shorter timeouts can detect failures faster but may lead to more frequent rebalances.
4. Network Configuration
- socket.send.buffer.bytes and socket.receive.buffer.bytes: Tuning these properties can help optimize the network performance of the Kafka brokers.
- replica.fetch.max.bytes: Sets the maximum data size a broker will try to fetch from another broker. This impacts replication performance.
5. Replication Configuration
- min.insync.replicas: Defines the minimum number of replicas that must acknowledge a write for it to be considered successful. Tuning this improves durability at the cost of potentially higher latency.
6. Other Important Configurations
- message.max.bytes: Sets the maximum size of a message that Kafka can accept. This is important when dealing with large messages.
- replica.lag.time.max.ms: Determines the maximum lag time a follower can have before it is considered out of sync. Adjusting this helps in maintaining data consistency across replicas.
- auto.create.topics.enable: Disabling this in production environments can prevent the unintended creation of topics with default settings, which might not be ideal for performance.
There are no silver bullets and that is why we do not recommend a certain value per property. Adjusting the above values must be done carefully, not in production first, and continuously tuned and iterated on.
Adopt dynamic sizing
Shifting from static to dynamic resource allocation in Kafka involves implementing strategies and tools that adjust resource usage based on current demand. This ensures that your Kafka clusters use the necessary resources at any given moment, optimizing performance and cost.
How to implement dynamic resource allocation for Kafka
Implement monitoring and alerting systems
- Real-time monitoring: Use monitoring tools to track resource utilization metrics such as CPU, memory, disk I/O, and network throughput.
- Alerting mechanisms: Set up alerts for thresholds that indicate when resources are under- or over-utilized.
Example tools:
- Prometheus and Grafana: Collect and visualize metrics and set up alerts.
- Datadog: Provides monitoring, alerting, and dashboards for real-time visibility.
- CloudWatch (AWS), Azure Monitor, Google Cloud Monitoring: Native cloud monitoring services.
Implement resource quotas and limits
- Quotas: Define quotas to limit the amount of resources that can be consumed or produced by individual Kafka clusters or tenants.
- Resource limits: Set resource limits to prevent any single process or user from consuming excessive resources.
Example tools:
- Apache Kafka's Quota Management: Controls the rate at which data is produced and consumed.
Wrapping up
You won’t find this type of guide for similar components because Kafka is truly unique. If you're just beginning your Kafka journey, it might be wise to bookmark this guide for future reference. However, if you're scaling up or anticipate significant growth in your Kafka usage, we strongly recommend preparing now by following the guidelines we've outlined. Failing to do so could lead to substantial and unexpectedly rapid cost increases. Happy streaming!