Loading…

Agents on a leash: Agentic AI remains mostly single-agent and monitored at work

AI’s impact on software engineering continues, and more and more of that AI is packaged as agents as results from our newest pulse survey show agentic usage has almost doubled (59%) since we last asked about it in our annual Developer Survey

Article hero image

AI’s impact on software engineering continues, and more and more of that AI is packaged as agents as results from our newest pulse survey show agentic usage has almost doubled (59%) since we last asked about it in our annual Developer Survey. Companies are scrambling to provide agent harnesses, infrastructure, and applications, but we wanted to know whether people were actually using agents in their daily work.

Our latest pulse survey shows AI agent usage has nearly doubled since last year, jumping from 31% to 59%, but total agent takeover is not here just yet. While enterprise leaders are leaning into the operational perks and worrying less about costs, 63% of technologists still rarely or never let agents run entirely on autopilot. Instead, the industry is settling into practical, single-agent workflows where human review remains the gold standard. Leaders say the positive side of agents overshadows concerns about costs, accuracy, and security, while developers maintain that regardless of work quality improving, security and accuracy are still a major concern.

Here is a look at the data behind the adoption boom, the tools winning the race, and why industries like fintech are leading the charge. 1,100 developers and working professionals responded to our survey from late April and let us know their thoughts on AI agents.

The revolution will not be fully autonomous or orchestrated (yet)

Full autonomy is a risk agentic users are not willing to take. Most (60%) of survey respondents block agents from making unapproved system changes, and 68% prefer predictable, single-agent setups over complex, multi-agent configurations. The single agent workflow of choice for the majority of respondents (full-stack developers) is GitHub Copilot (65%) or Claude Code (50%).

Developers are still part of the process for coding, and they have been more skeptical about accuracy since we started asking about it in 2023. While there are fewer people using multiple specialized agents, let alone multiple orchestrated agents, the ones who do orchestrate multiple agents use agentic workflows daily more than single agent users. These daily, multi-agent users use Claude Code the most (70%), but also DIY with frameworks (OpenAI SDK 18%) and vector databases (ElasticSearch 17%).
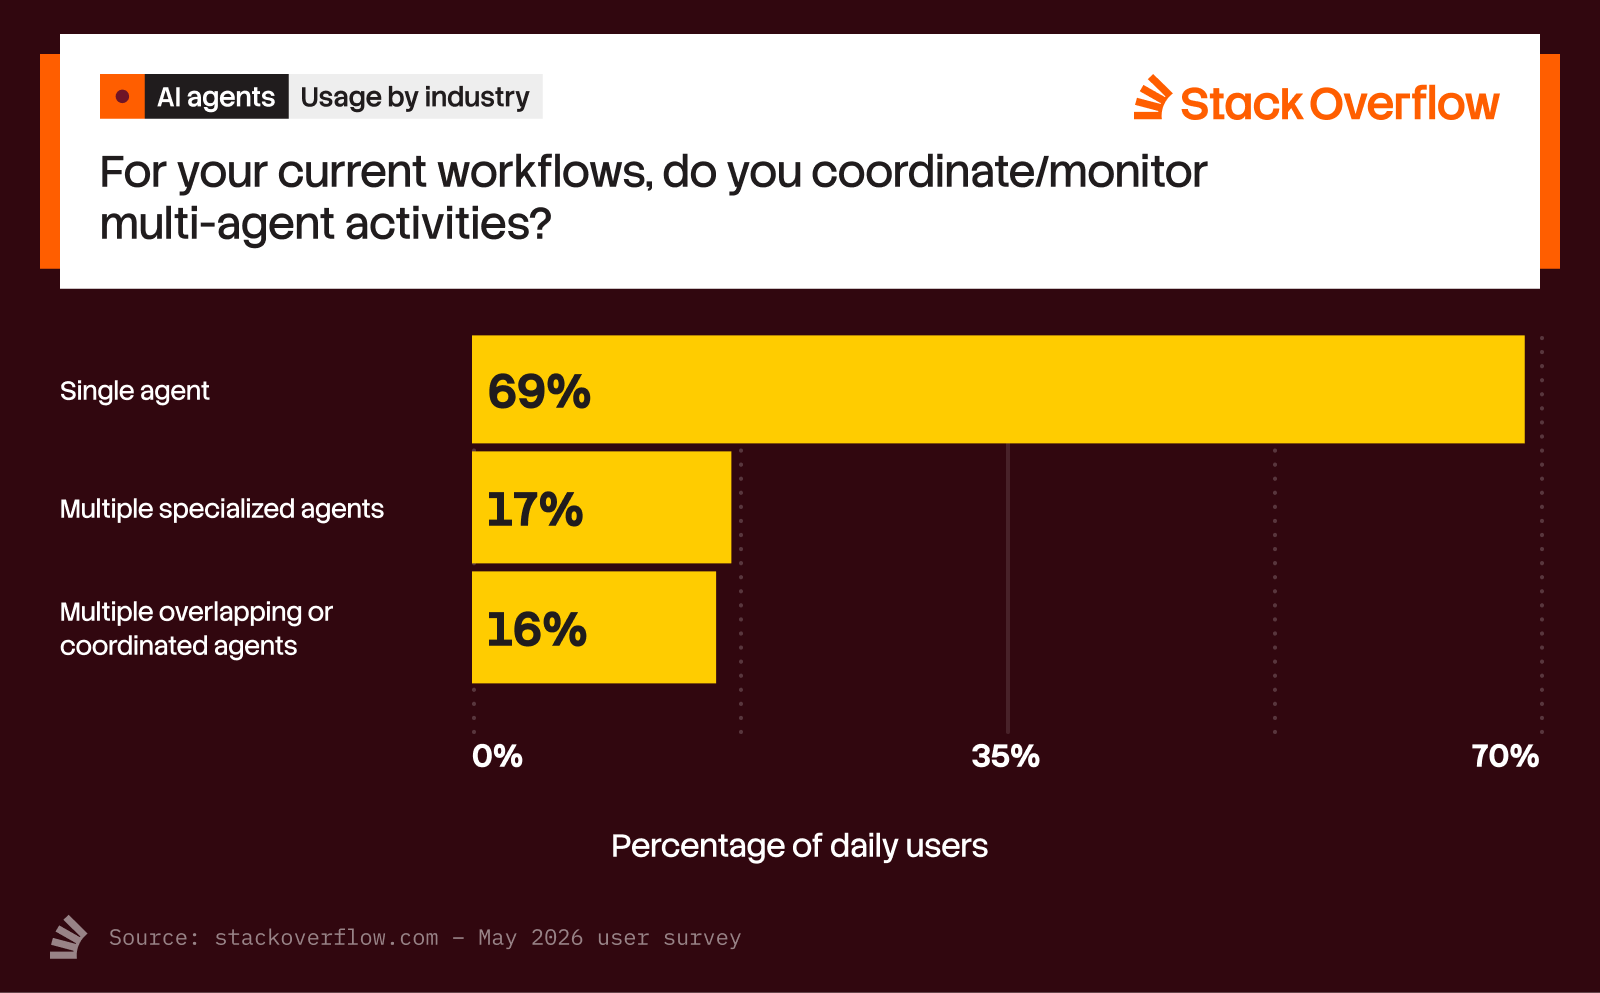
A bar chart titled "AI Agent Setup" from Stack Overflow, asking, "For your current workflows, do you coordinate/monitor multi-agent activities?" 

- Single Agent: 68% (largest bar)
- Multiple Specialized Agents: 17%
- Multiple Overlapping or Coordinated Agents: 16%
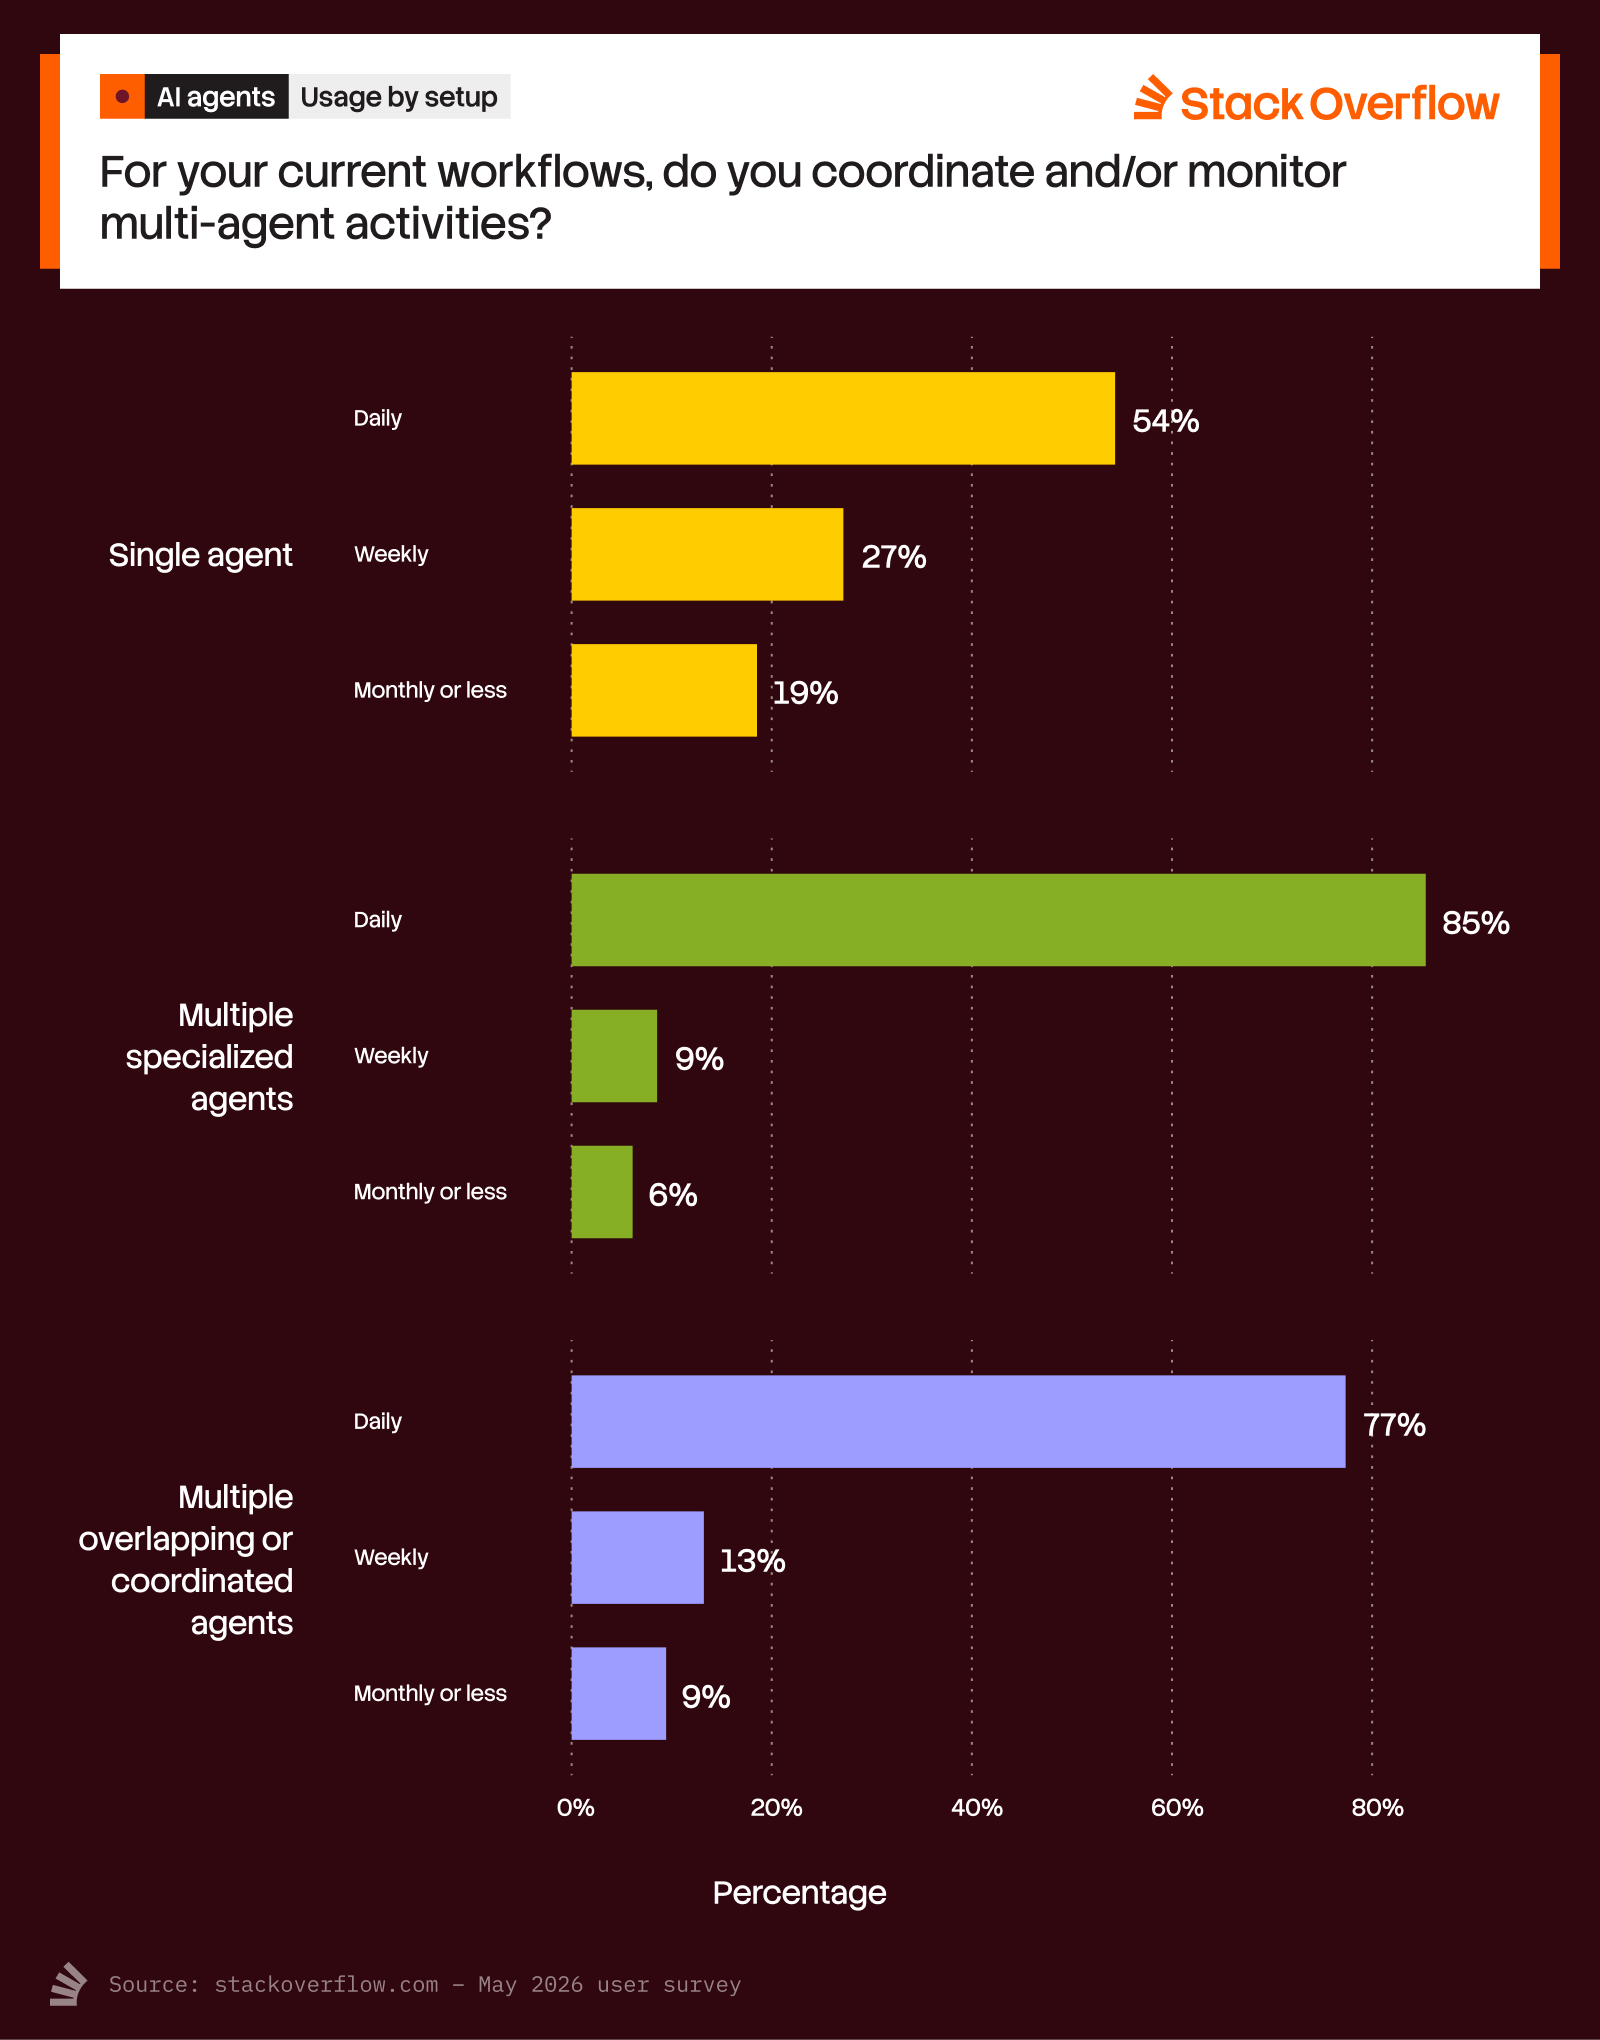
A bar chart titled "AI Agent Usage by Agent Setup" from Stack Overflow, asking, "For your current workflows, do you coordinate/monitor multi-agent activities?" The chart breaks down usage frequency (Daily, Weekly, Monthly or less) for three agent setups:

1. Single Agent:
   - Daily: 54%
   - Weekly: 27%
   - Monthly or less: 19%

2. Multiple Specialized Agents:
   - Daily: 85% (highest percentage in this category)
   - Weekly: 9%
   - Monthly or less: 6%

3. Multiple Overlapping or Coordinated Agents:
   - Daily: 77%
   - Weekly: 13%
   - Monthly or less: 9%
A bar chart titled "AI Agent Workflow Autonomy" from Stack Overflow, asking, "For your current workflows, do you currently allow AI agents to complete tasks without your intervention?" The chart shows the distribution of responses:

1. Never: 36% - "I review all prompt output before an agent makes any changes or accesses any files."
2. Rarely: 24% - "I review most of my agents' work, stopping frequently to review suggestions and tasks before they are completed."
3. Sometimes: 19% - "I allow agents to work autonomously on simple tasks, frequently halting progress on complex tasks."
4. Often: 15% - "I allow agents to work autonomously on simple and complex tasks but closely monitor and stop progress occasionally."
5. Mostly: 6% - "I allow agents to work for long periods on simple and complex tasks without my intervention."

Your boss is using AI agents more this year

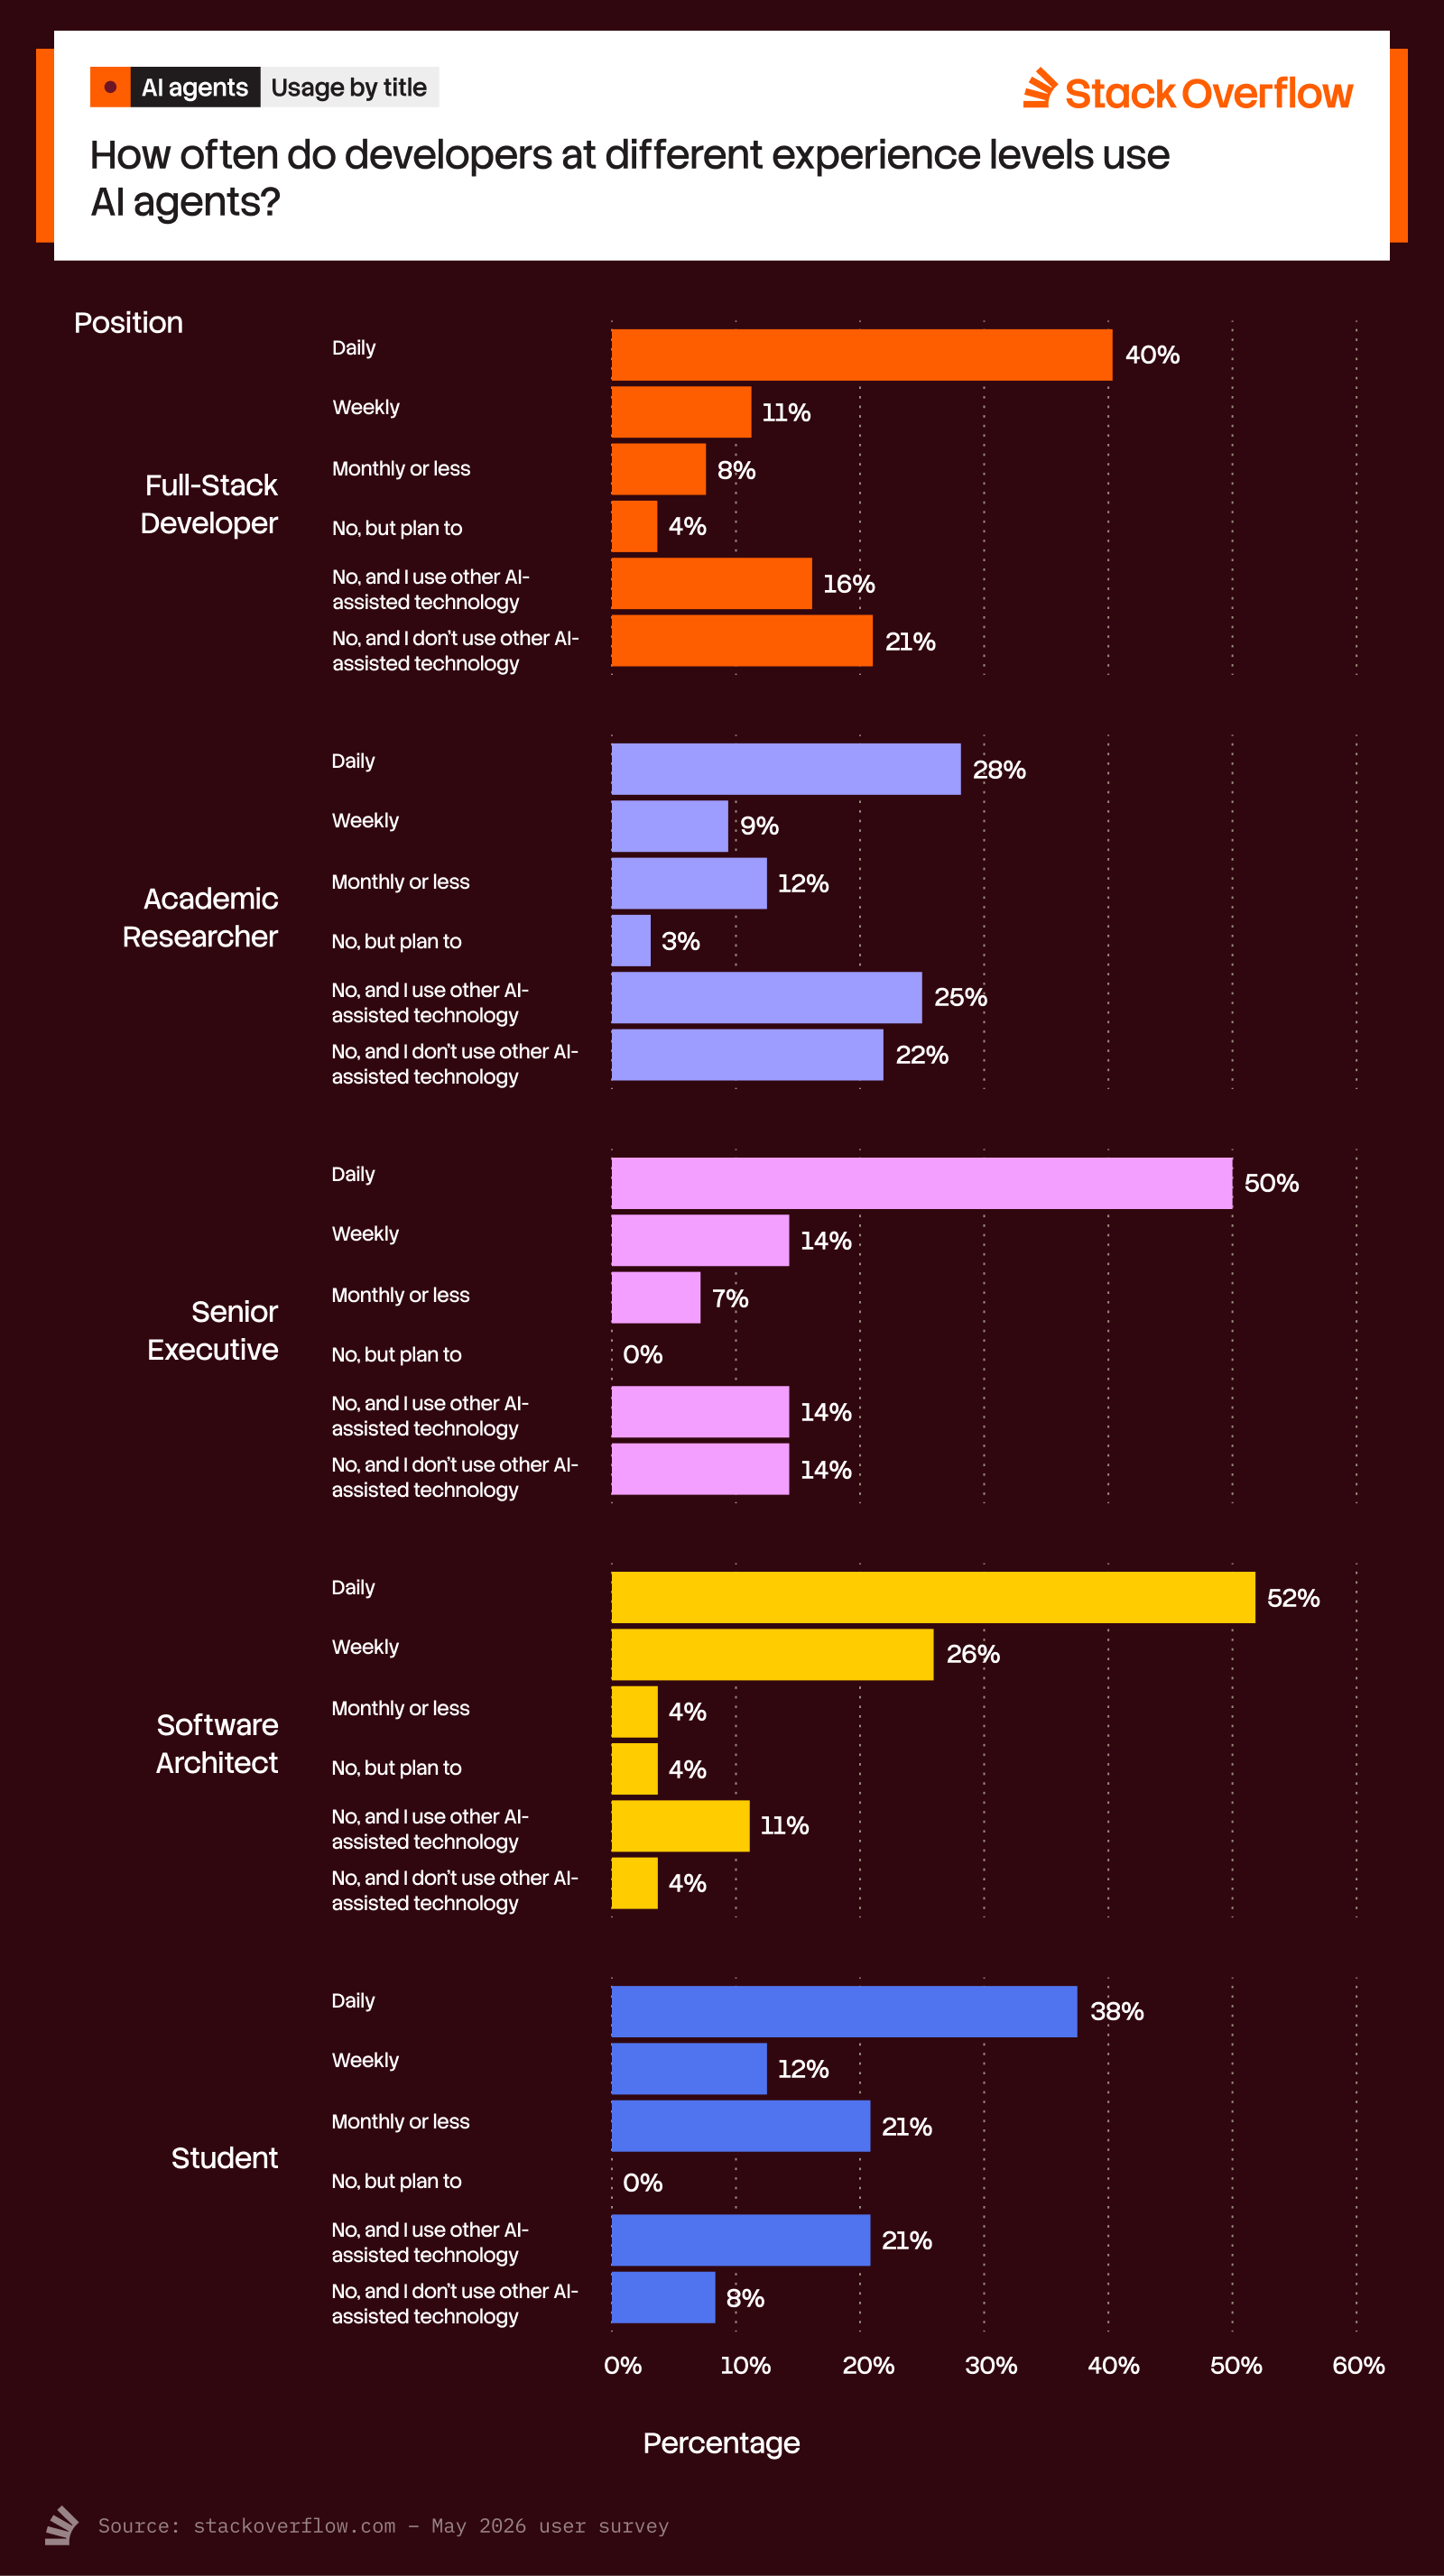
Workplace agent usage has nearly doubled since last year, but it’s not just developers using them. When we asked about AI agents last year, we saw many developers were using AI. Fewer developers were using agents, but were planning to. This new survey shows 59% use agents at work at any frequency, compared to 31% in the 2025 Developer Survey. The growth is primarily in daily use, showing how these embedded tools have seamlessly become part of many aspects of work. That daily usage is partly driven by developers (40% report daily use), but also architects (52% daily use) and senior executives (50% daily use).

Executive sponsorship is actively shaping the modern enterprise tech stack. The differing results we see with students (38% daily use) and academic researchers (28% daily use) would suggest that the absence of typical workplace productivity goals and possibly the continued concern over accuracy in AI output remains a blocker for those in learning or research-focused settings.
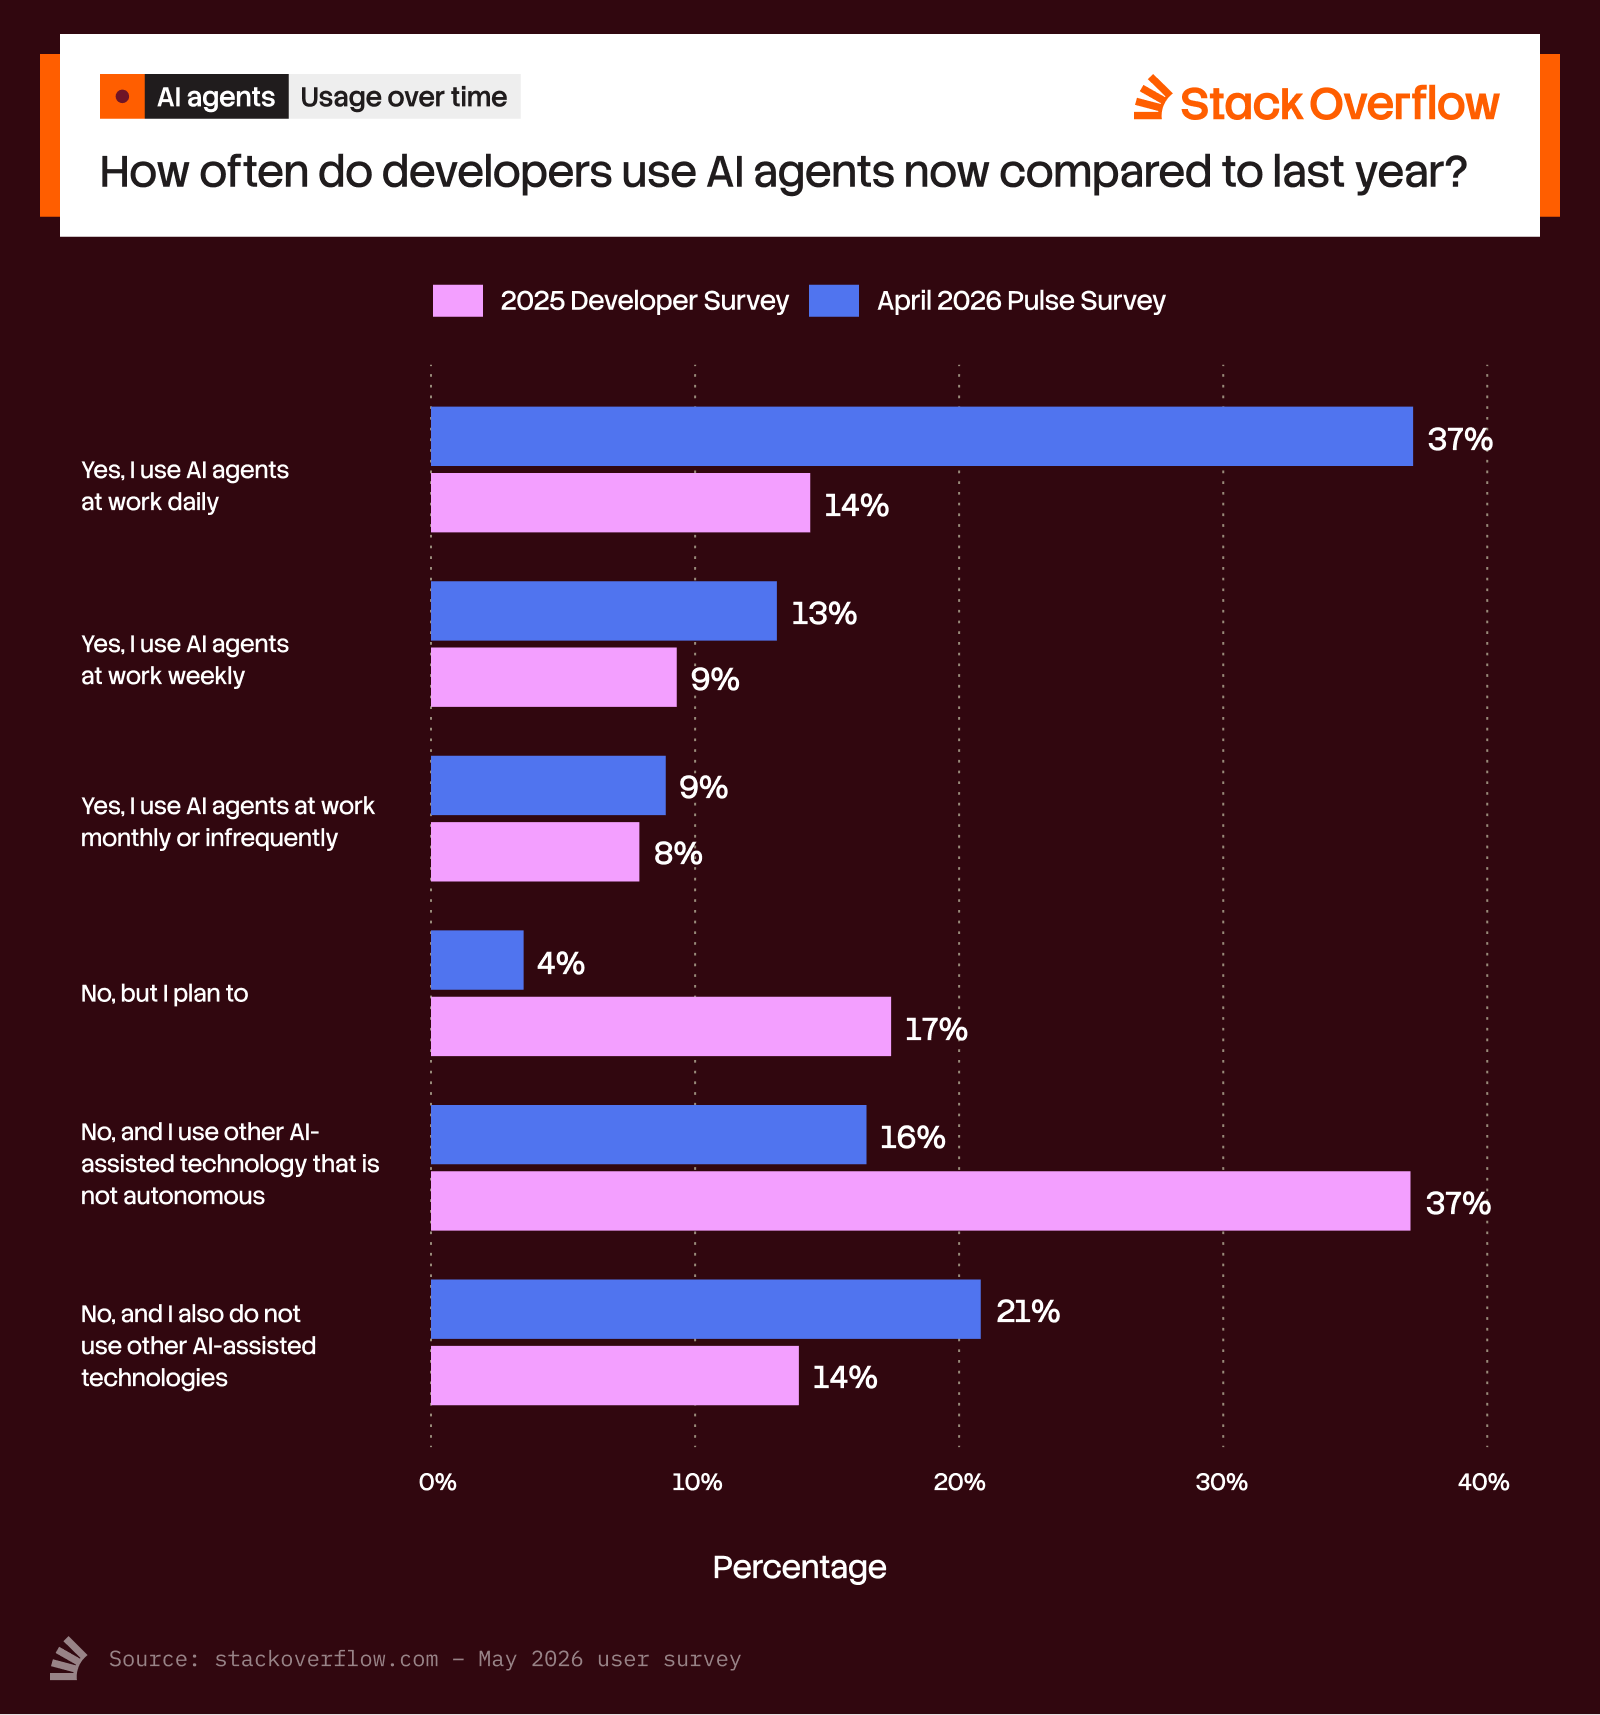
A bar chart titled "AI Agent Usage Comparison" from Stack Overflow, asking, "Are you using AI agents in your work (development or otherwise)?" The chart compares responses from the 2025 Developer Survey (pink bars) and the April 2026 Pulse Survey (blue bars):

1. Yes, I use AI agents at work daily:
   - 2025: 14%
   - 2026: 37% (significant increase)

2. Yes, I use AI agents at work weekly:
   - 2025: 9%
   - 2026: 13%

3. Yes, I use AI agents at work monthly or infrequently:
   - 2025: 8%
   - 2026: 9%

4. No, but I plan to:
   - 2025: 17%
   - 2026: 4% (sharp decrease)

5. No, and I use other AI-assisted technology that is not autonomous:
   - 2025: 37%
   - 2026: 16% (significant decrease)

6. No, and I also do not use other AI-assisted technologies:
   - 2025: 14%
   - 2026: 21%
A bar chart titled "AI Agent Usage by Job Title" from Stack Overflow's April 2026 Pulse Survey, asking, "Are you using AI agents in your work (development or otherwise)?" The chart breaks down responses by job title:

1. Full-Stack Developer:
   - Daily: 40%
   - Weekly: 11%
   - Monthly or less: 8%
   - No, but I plan to: 4%
   - No, and I use other AI-assisted technology: 16%
   - No, and I don’t use other AI-assisted technology: 21%

2. Academic Researcher:
   - Daily: 28%
   - Weekly: 9%
   - Monthly or less: 12%
   - No, but I plan to: 3%
   - No, and I use other AI-assisted technology: 25%
   - No, and I don’t use other AI-assisted technology: 22%

3. Senior Executive:
   - Daily: 50%
   - Weekly: 14%
   - Monthly or less: 7%
   - No, but I plan to: 0%
   - No, and I use other AI-assisted technology: 14%
   - No, and I don’t use other AI-assisted technology: 14%

4. Software Architect:
   - Daily: 52%
   - Weekly: 26%
   - Monthly or less: 4%
   - No, but I plan to: 4%
   - No, and I use other AI-assisted technology: 11%
   - No, and I don’t use other AI-assisted technology: 4%

5. Student:
   - Daily: 38%
   - Weekly: 12%
   - Monthly or less: 21%
   - No, but I plan to: 0%
   - No, and I use other AI-assisted technology: 21%
   - No, and I don’t use other AI-assisted technology: 9%

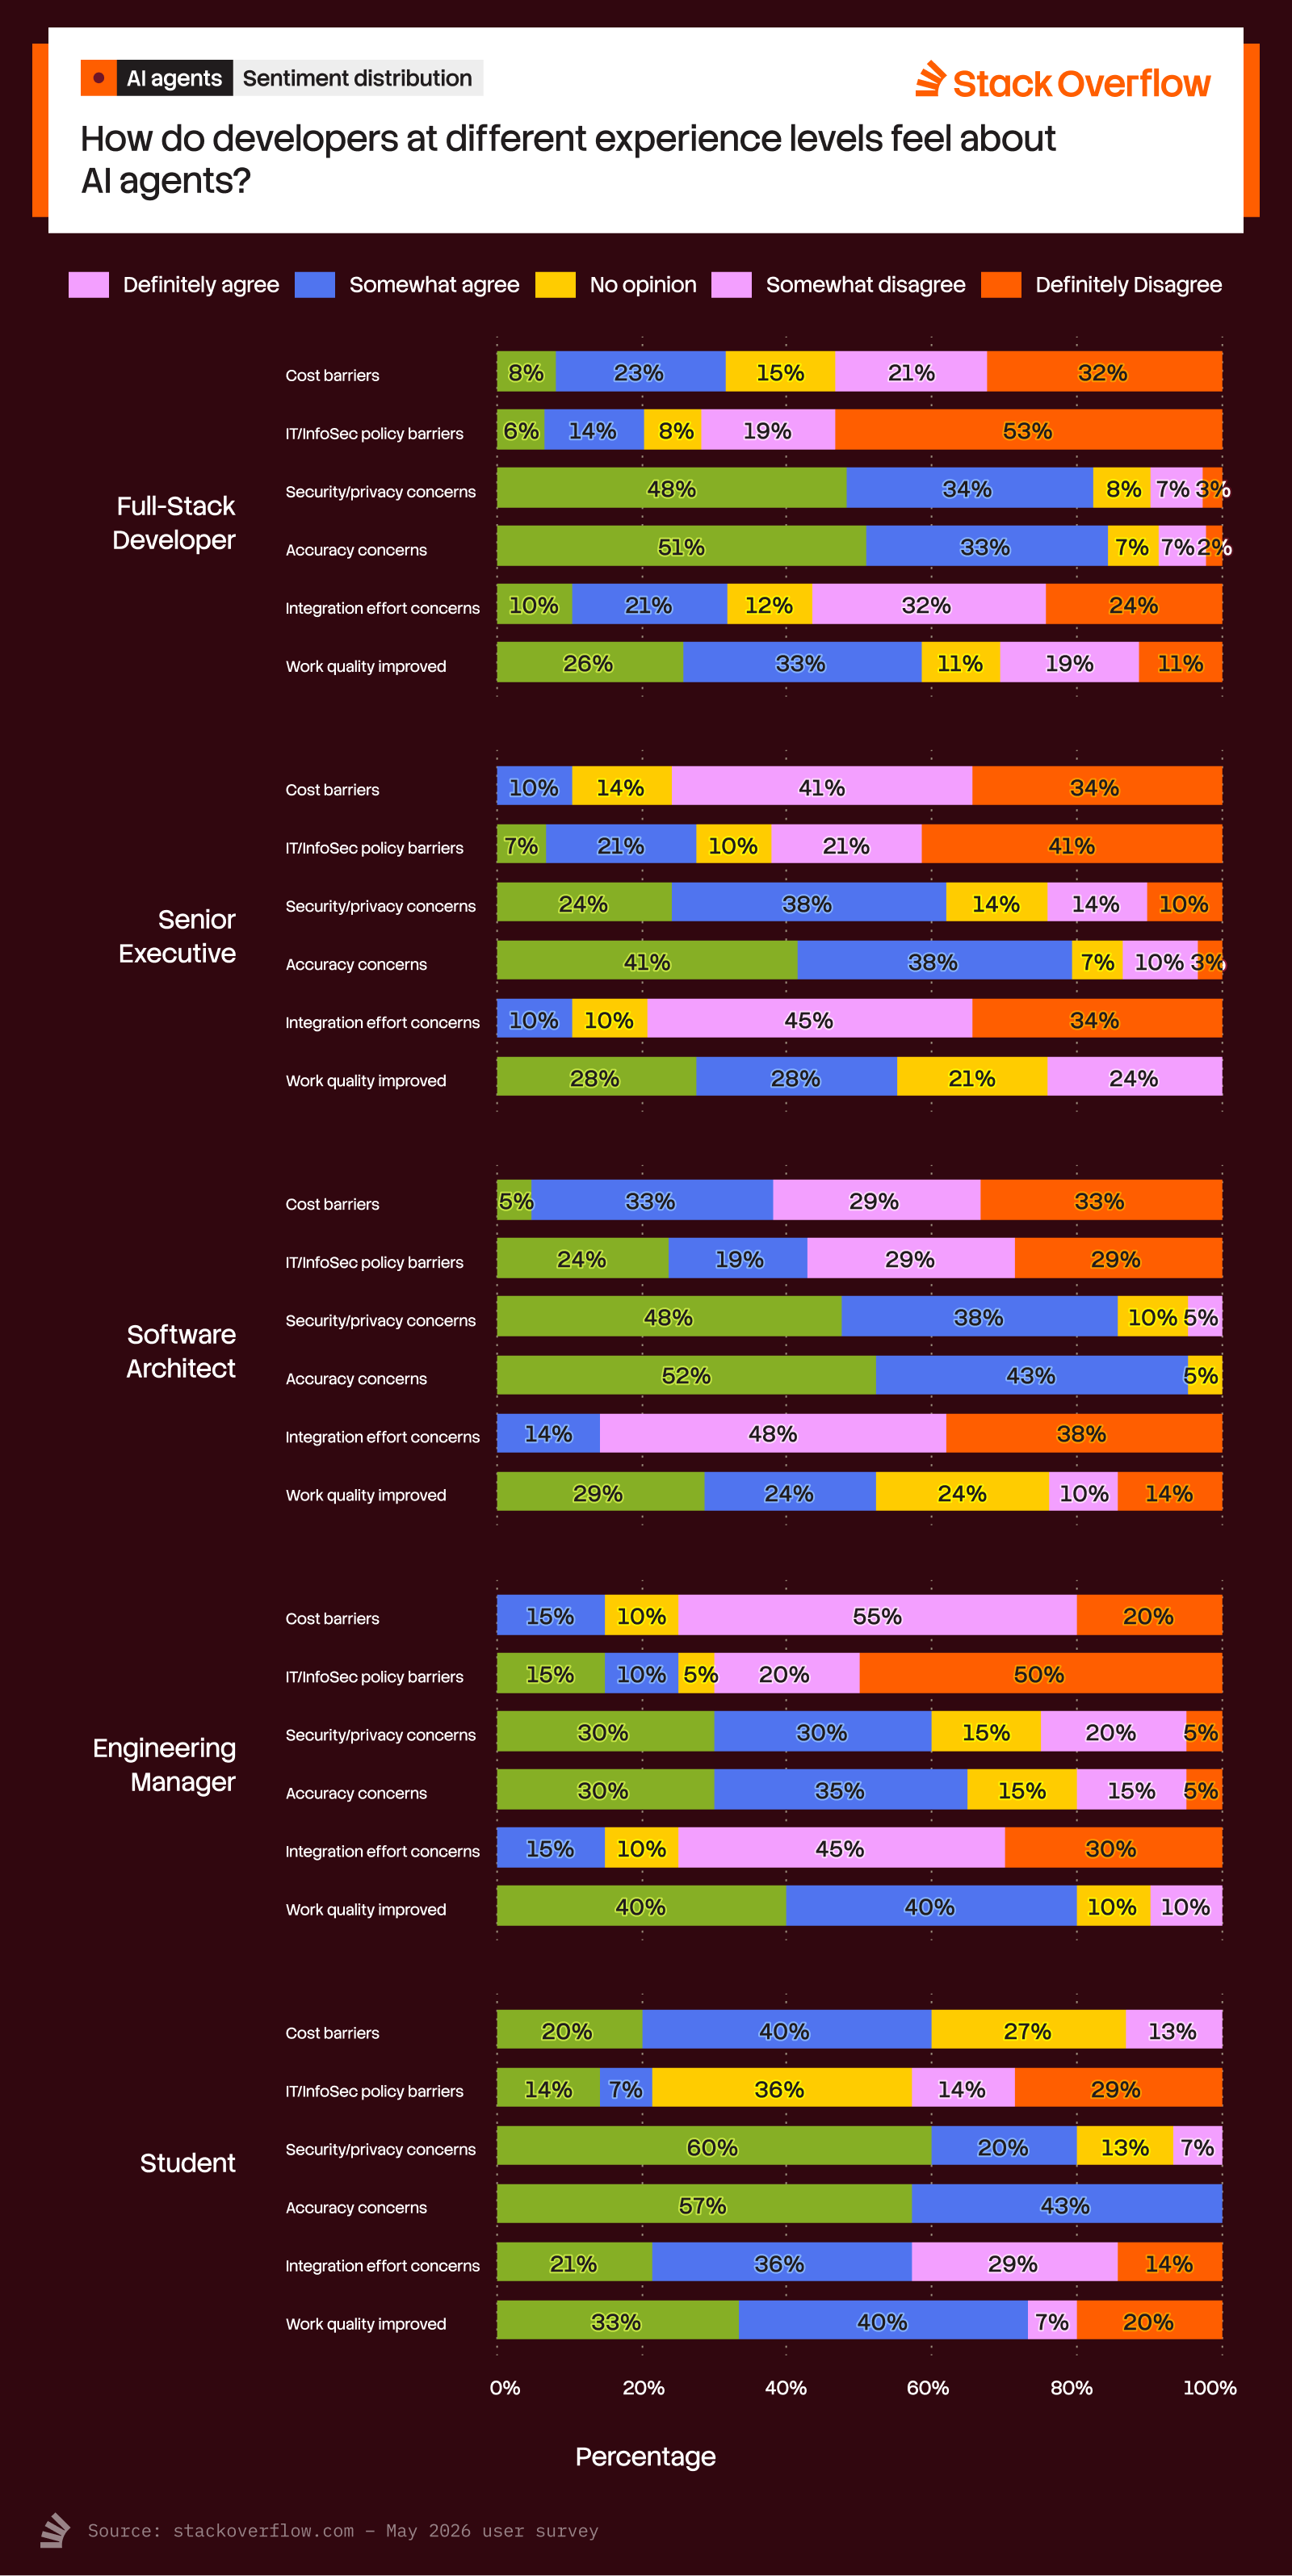
Considering the growth in agents at work, and where the fire is being lit to encourage more daily agent usage, we also asked how everyone is feeling about the typical AI concerns. Our top five job role respondents let us know that the concerns are still there but diminish a bit for daily users. Executives and engineering managers are the least worried about cost: 75% of executives and 65% of engineering managers disagree or strongly disagree that cost is a barrier to using agents. In last year’s Developer Survey, 53% of users saw cost as a barrier to using agents. That’s fallen to 38% who agree or strongly agree that cost is a barrier.

Accuracy and security remain the top two concerns with using agents at work, both in this pulse survey and in last year’s Developer Survey. However, accuracy concerns have decreased from 57% strongly agreeing that accuracy was a barrier for agentic use to 47%. The percentage of respondents who strongly agree that security concerns are a barrier to adoption dropped to 44% from 56%. Architects and students are more sensitive to accuracy and security concerns, while engineering managers are less concerned.
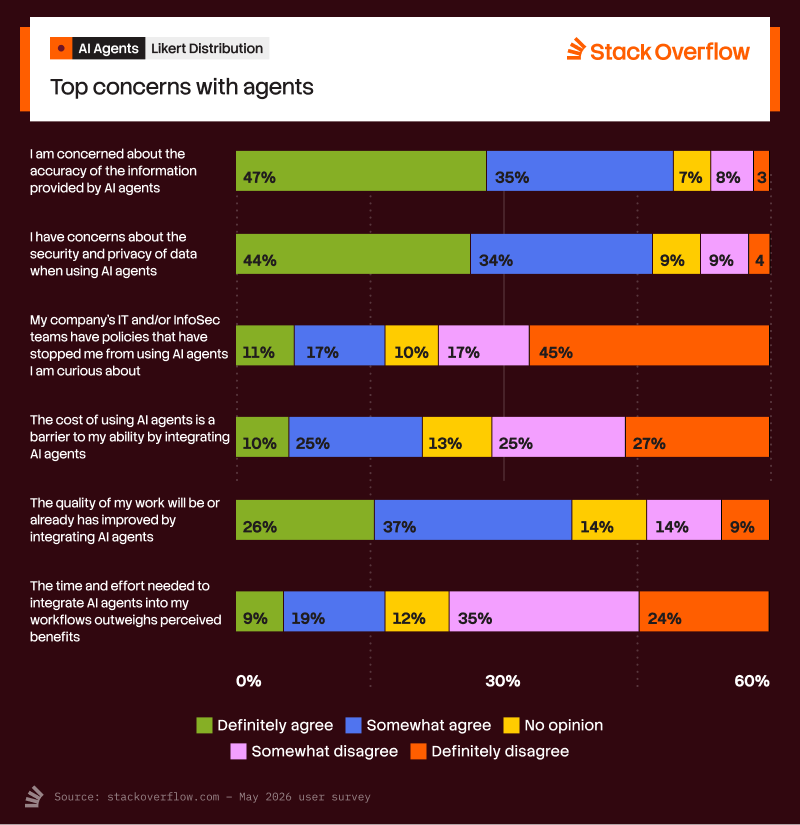
A stacked bar chart titled "AI Agent Sentiment" from Stack Overflow, showing the distribution of agreement levels across five statements about AI agents. The chart uses color-coded segments for responses: "Definitely agree," "Somewhat agree," "No opinion," "Somewhat disagree," and "Definitely disagree."

1. Concern about the accuracy of information provided by AI agents:
   - Definitely agree: 47%
   - Somewhat agree: 35%
   - No opinion: 7%
   - Somewhat disagree: 8%
   - Definitely disagree: 3%

2. Concerns about the security and privacy of data when using AI agents:
   - Definitely agree: 44%
   - Somewhat agree: 33%
   - No opinion: 9%
   - Somewhat disagree: 9%
   - Definitely disagree: 4%

3. Policies from IT/InfoSec teams stopping AI agent use:
   - Definitely agree: 11%
   - Somewhat agree: 17%
   - No opinion: 10%
   - Somewhat disagree: 17%
   - Definitely disagree: 46%

4. Cost of using AI agents as a barrier to work:
   - Definitely agree: 10%
   - Somewhat agree: 25%
   - No opinion: 13%
   - Somewhat disagree: 25%
   - Definitely disagree: 27%

5. Quality of work improved by integrating AI agents:
   - Definitely agree: 26%
   - Somewhat agree: 37%
   - No opinion: 14%
   - Somewhat disagree: 14%
   - Definitely disagree: 9%

6. Time and effort to integrate AI agents outweighing benefits:
   - Definitely agree: 9%
   - Somewhat agree: 19%
   - No opinion: 12%
   - Somewhat disagree: 35%
   - Definitely disagree: 24%
A stacked bar chart titled "AI Agent Sentiment by Job Title" from Stack Overflow, showing the distribution of agreement levels across five AI agent sentiment statements for different job titles. The chart uses color-coded segments for responses: "Definitely agree," "Somewhat agree," "No opinion," "Somewhat disagree," and "Definitely disagree."

Job Titles and Sentiments:

1. Full-Stack Developer:
   - Cost barriers: Majority disagree (52% somewhat disagree, 32% definitely disagree).
   - IT/InfoSec policy barriers: 63% disagree (46% somewhat, 17% definitely).
   - Security/privacy concerns: 46% agree (34% somewhat, 12% definitely).
   - Accuracy concerns: 61% agree (33% somewhat, 28% definitely).
   - Integration effort concerns: 56% disagree (32% somewhat, 24% definitely).
   - Work quality improved: 59% agree (30% somewhat, 29% definitely).

2. Senior Executive:
   - Cost barriers: 34% disagree (41% somewhat, 34% definitely).
   - IT/InfoSec policy barriers: 50% disagree (29% somewhat, 21% definitely).
   - Security/privacy concerns: 62% agree (38% somewhat, 24% definitely).
   - Accuracy concerns: 79% agree (38% somewhat, 41% definitely).
   - Integration effort concerns: 62% disagree (34% somewhat, 28% definitely).
   - Work quality improved: 57% agree (28% somewhat, 29% definitely).

3. Software Architect:
   - Cost barriers: 66% disagree (46% somewhat, 20% definitely).
   - IT/InfoSec policy barriers: 60% disagree (50% somewhat, 10% definitely).
   - Security/privacy concerns: 67% agree (38% somewhat, 29% definitely).
   - Accuracy concerns: 80% agree (52% somewhat, 28% definitely).
   - Integration effort concerns: 66% disagree (38% somewhat, 28% definitely).
   - Work quality improved: 53% agree (24% somewhat, 29% definitely).

4. Engineering Manager:
   - Cost barriers: 67% disagree (40% somewhat, 27% definitely).
   - IT/InfoSec policy barriers: 57% disagree (50% somewhat, 7% definitely).
   - Security/privacy concerns: 60% agree (30% somewhat, 30% definitely).
   - Accuracy concerns: 65% agree (35% somewhat, 30% definitely).
   - Integration effort concerns: 78% disagree (48% somewhat, 30% definitely).
   - Work quality improved: 80% agree (40% somewhat, 40% definitely).

5. Student:
   - Cost barriers: 66% disagree (40% somewhat, 26% definitely).
   - IT/InfoSec policy barriers: 57% disagree (50% somewhat, 7% definitely).
   - Security/privacy concerns: 60% agree (30% somewhat, 30% definitely).
   - Accuracy concerns: 65% agree (35% somewhat, 30% definitely).
   - Integration effort concerns: 78% disagree (48% somewhat, 30% definitely).
   - Work quality improved: 80% agree (40% somewhat, 40% definitely).

Fintech, advertising, and Lovable lead the way

Industries are taking up agentic tool use differently—this is reflected in some of the no-code tools we see growing in usage. Fintech and media/advertising industries are leading the way in daily agentic usage (55% and 50% respectively), even more than software development (44% daily usage). Fintech is having an interesting moment with the convergence of prediction market popularity, cryptocurrency entering major financial institutions, and sports gambling apps that all rely on data to power their real-time features. Agents and agentic tools are helping fintech continue to power these data products, whether directly through building internally or indirectly through providing data for the public to consume into agents of their own.

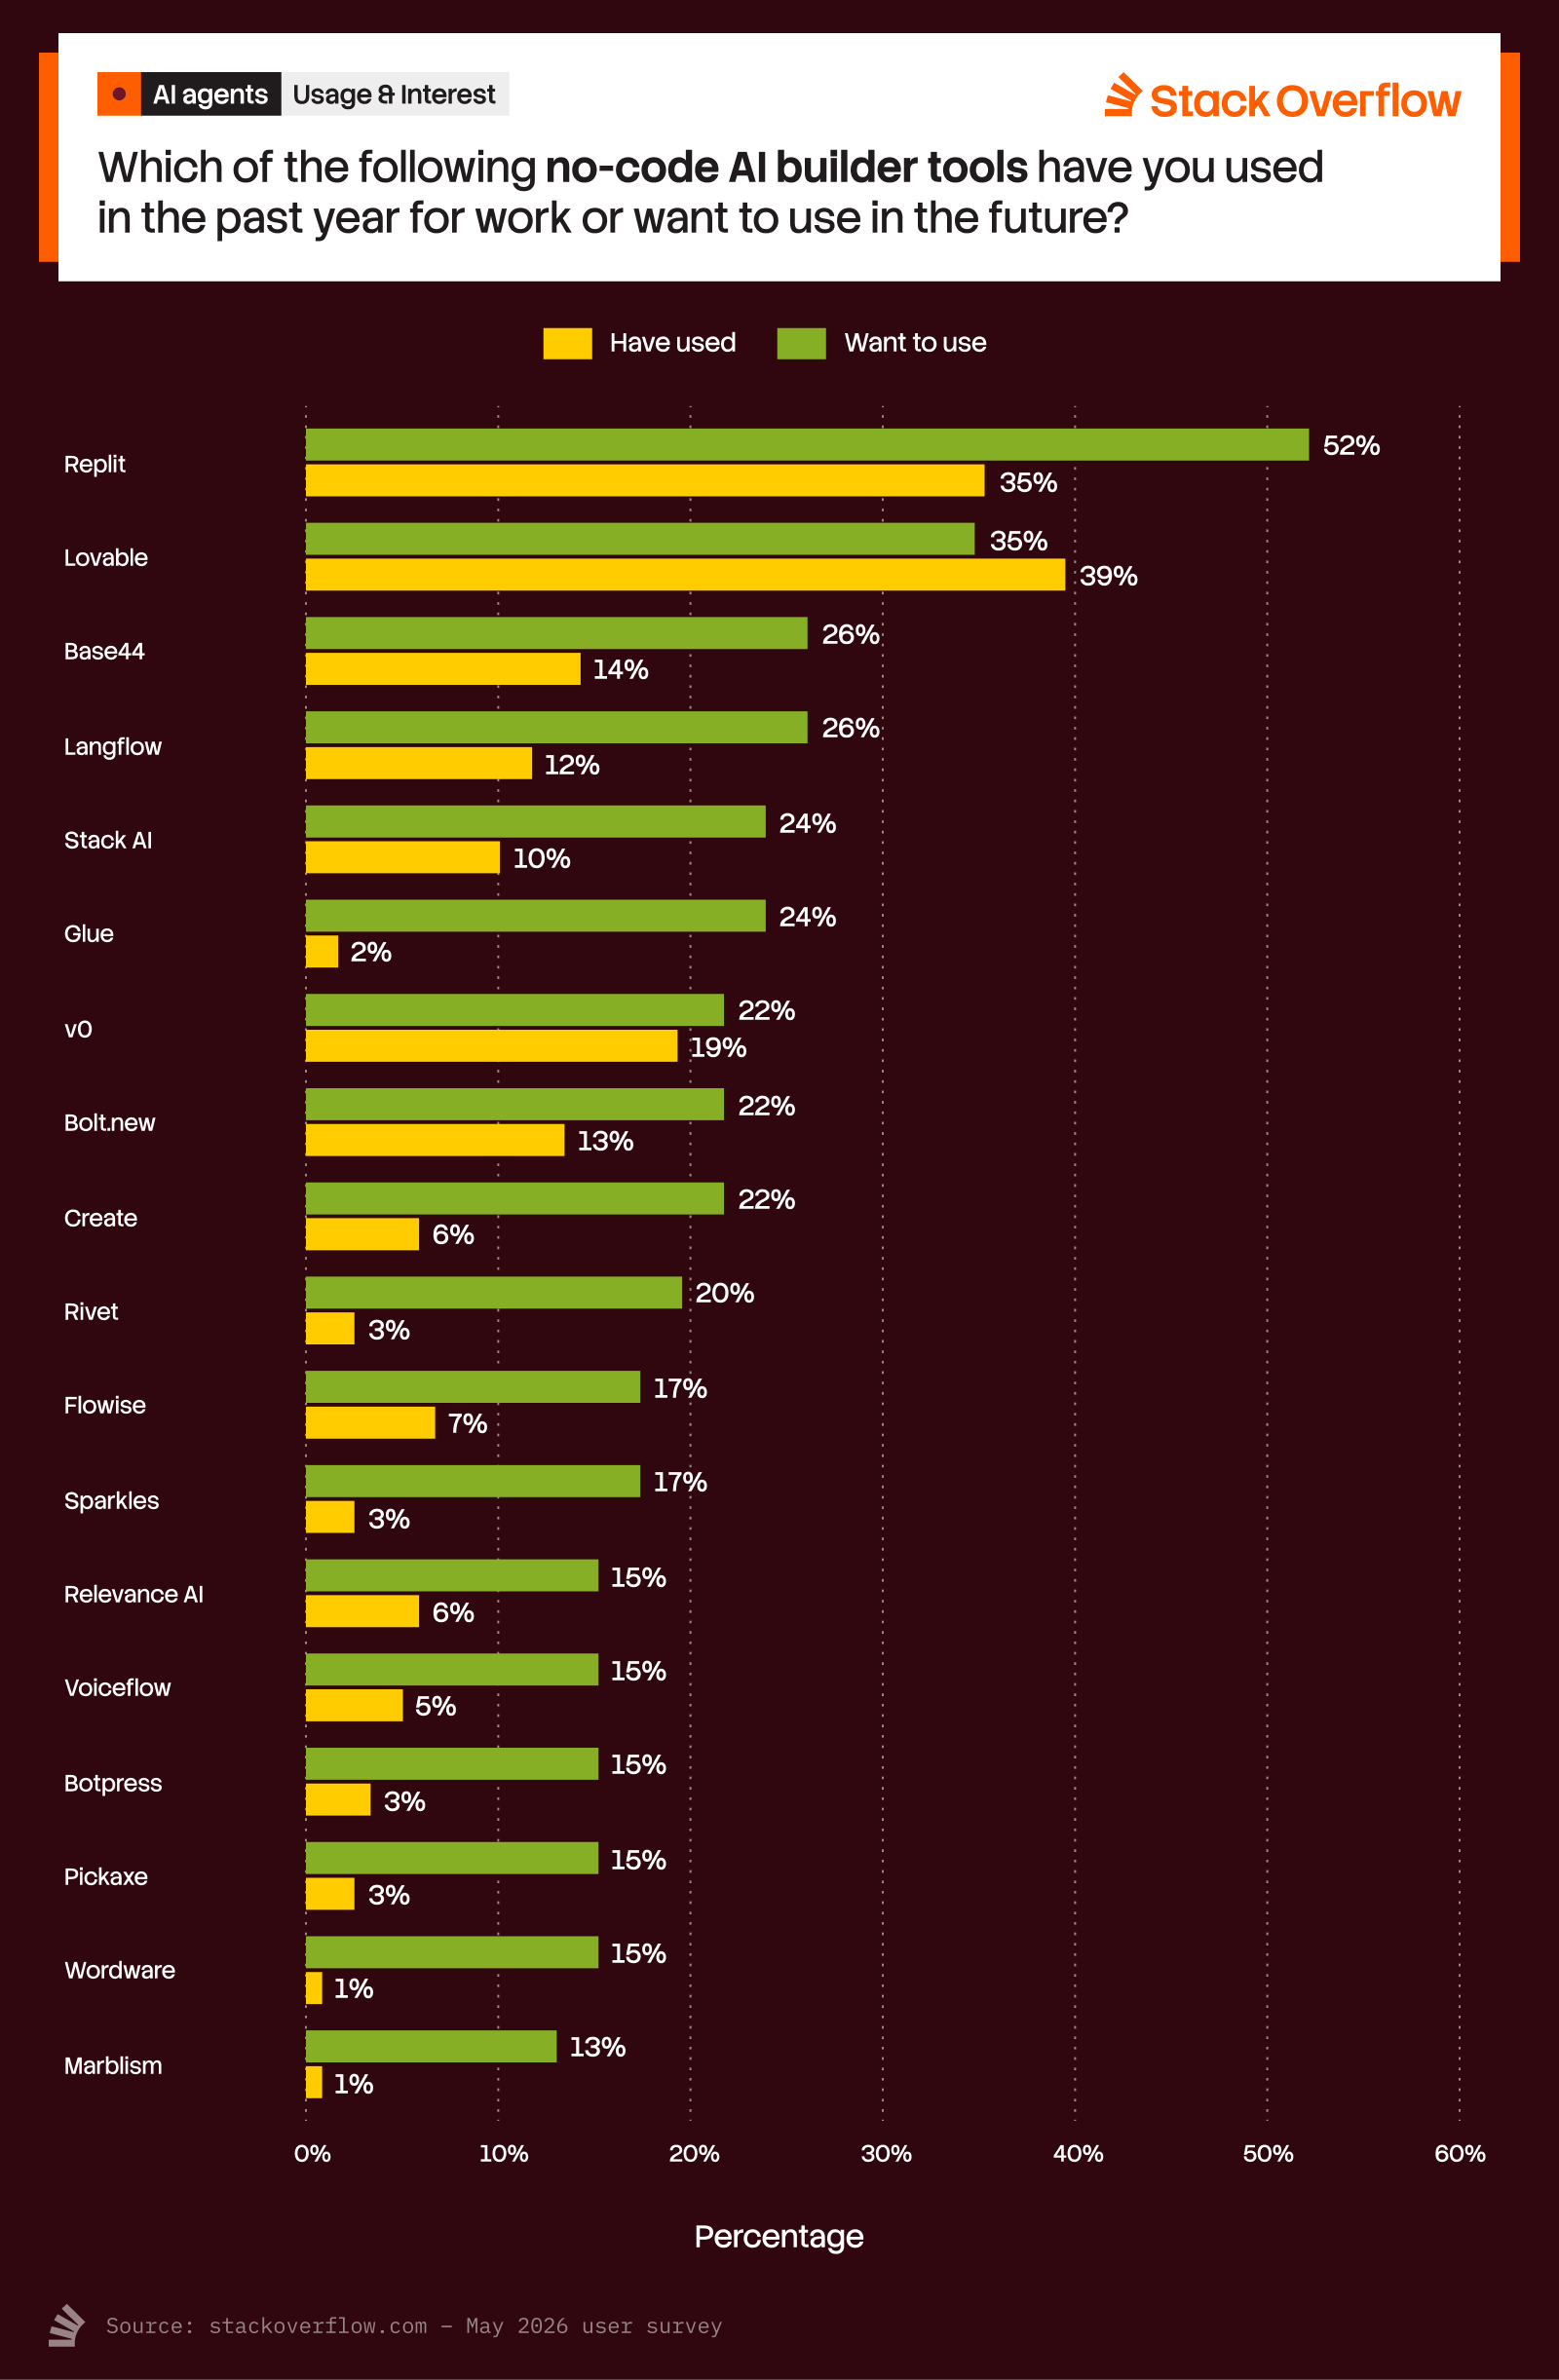
Media and advertising is having a moment with AI as well. Meta announced their AI advertising product in 2025 right as new no-code/vibe coding agents were starting to hit the market. Lovable and Base44 offered many a glimpse into how agents would impact traditional website and video marketing by offering an easy way to produce online assets in record time. Agentic no-code tooling is bringing more non-native technology users into the agentic development process. Among the no-code agent tools we asked about in the pulse survey, the most popular options were Lovable (28%), Replit (27%), and v0 (20%). All three of these tools have experienced growth in usage since the 2025 Developer Survey (Lovable and Replit both grew in usage by 22 percentage points, v0 by 11 points) and show high interest for usage in the next six months (Replit being the highest overall with 25%). Notable mentions for high interest also goes to Base44 (13%), Langflow (13%), and Glue (12%).
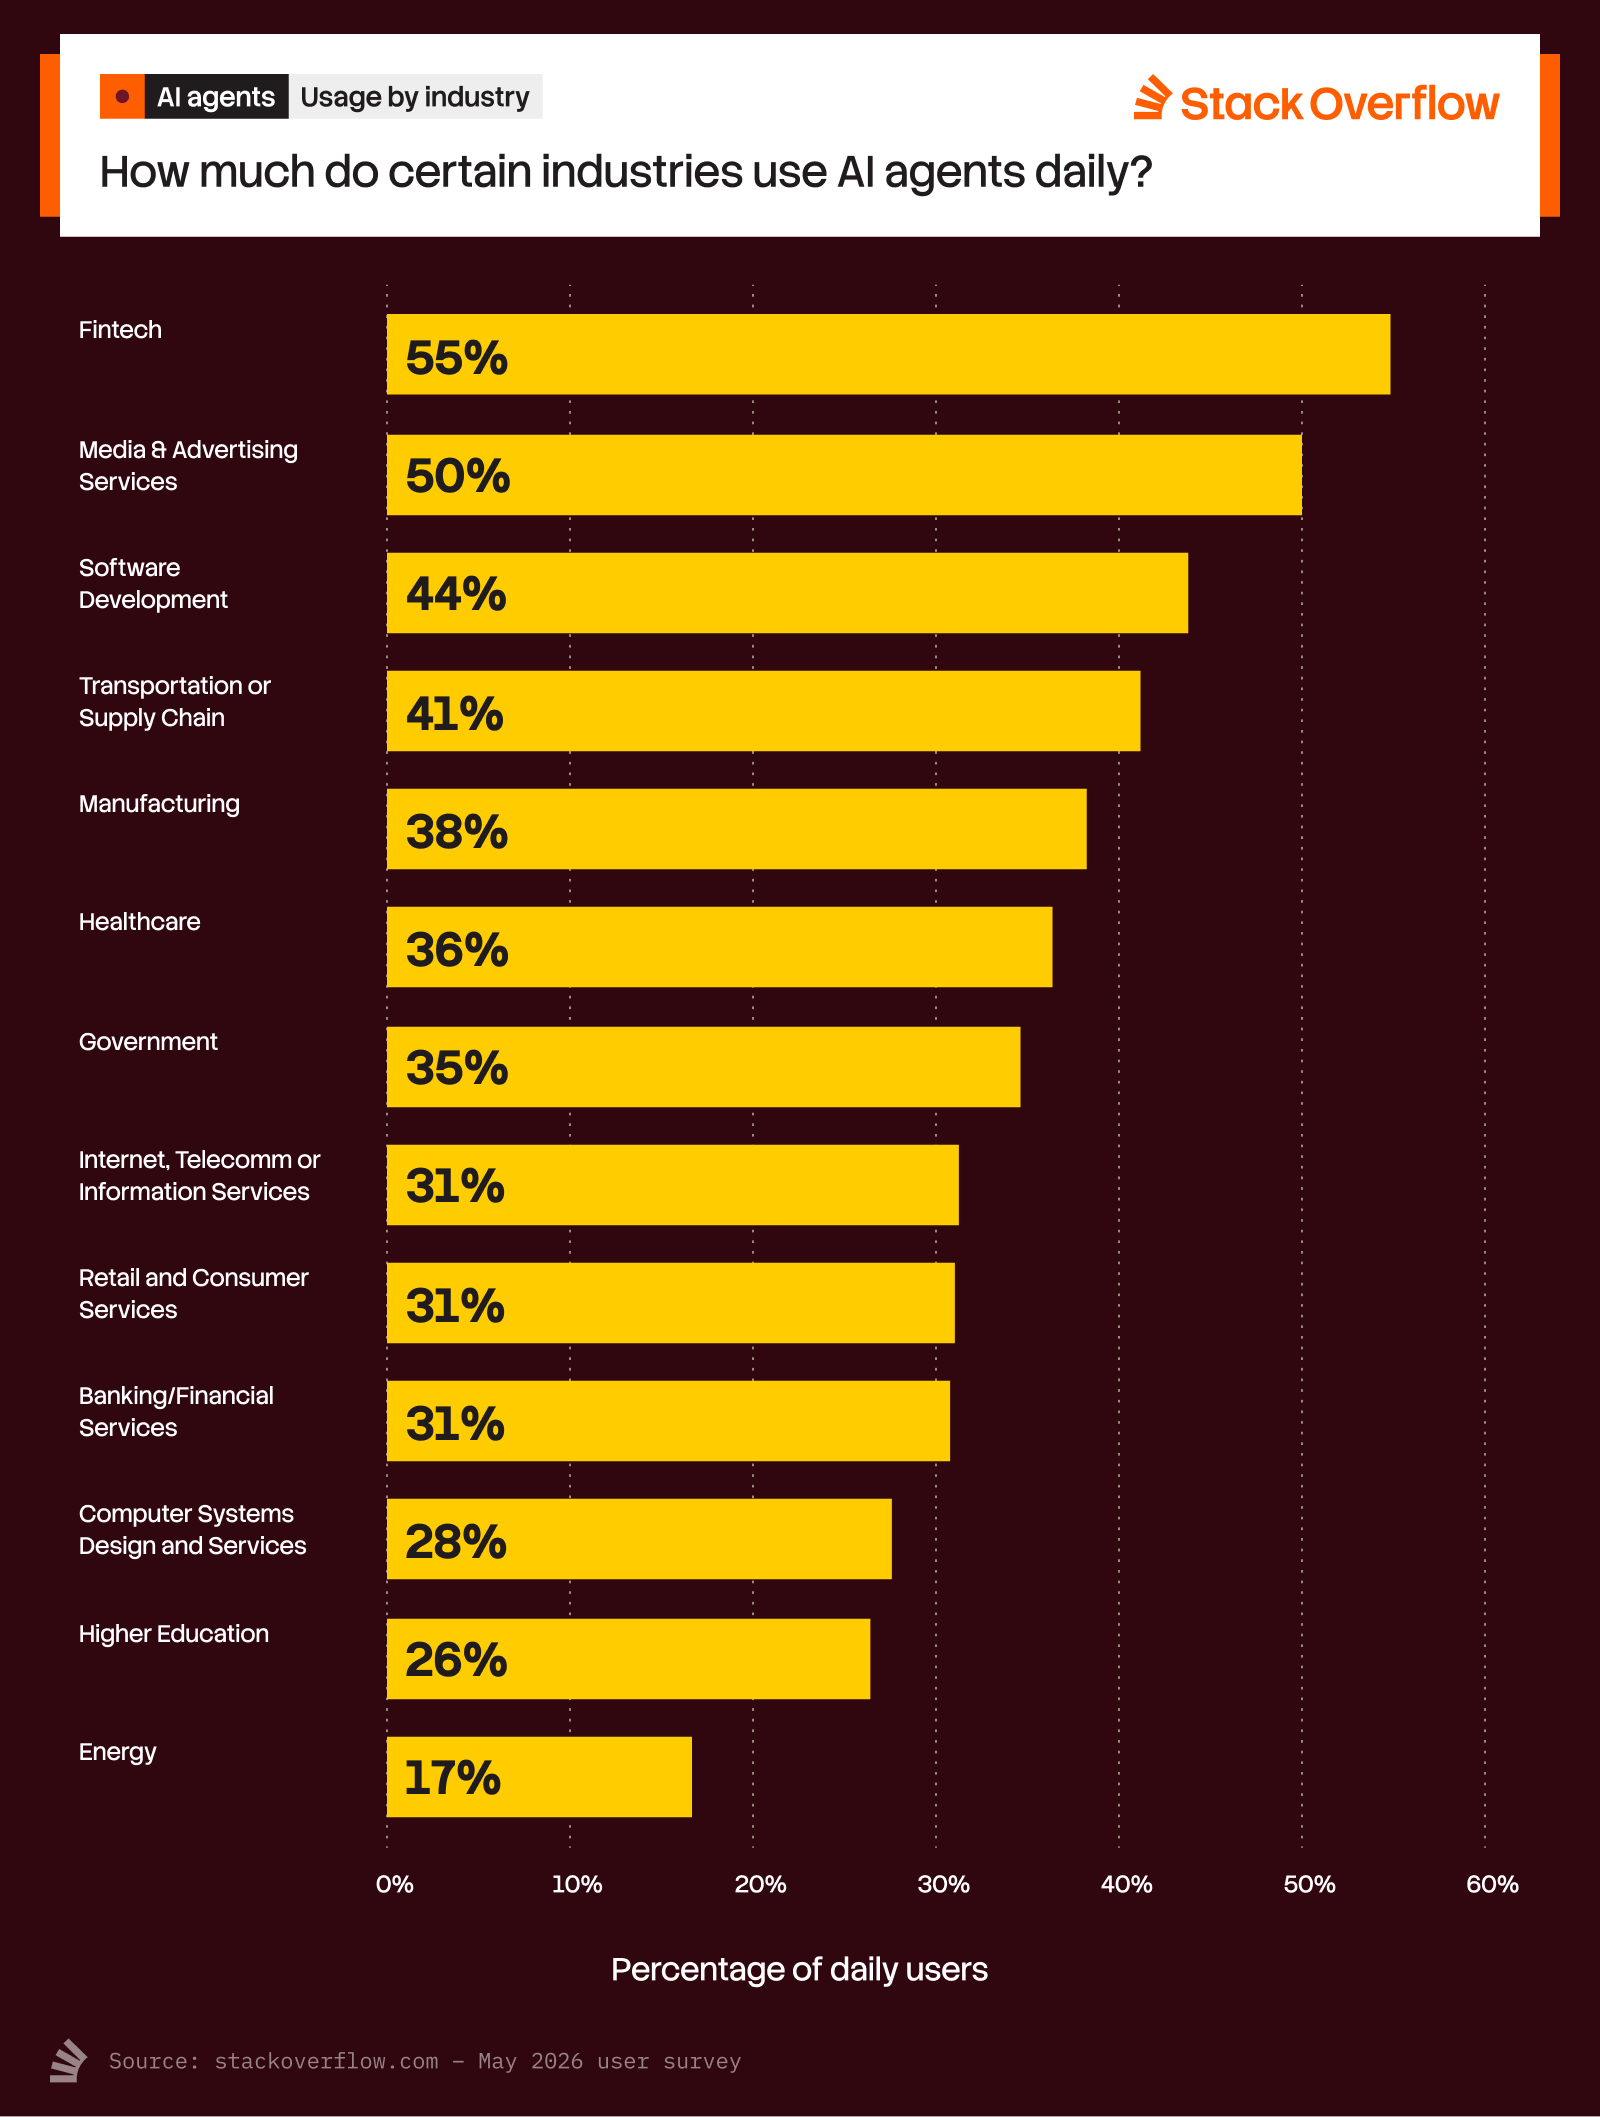
A bar chart titled "Daily AI Agent Usage by Industry" from Stack Overflow, asking, "Are you using AI agents in your work (development or otherwise)?" The chart shows the percentage of daily AI agent usage across various industries:

1. Fintech: 55%  
2. Media & Advertising Services: 50%  
3. Software Development: 44%  
4. Transportation or Supply Chain: 41%  
5. Manufacturing: 38%  
6. Healthcare: 36%  
7. Government: 35%  
8. Internet, Telecom, or Information Services: 31%  
9. Retail and Consumer Services: 31%  
10. Banking/Financial Services: 31%  
11. Computer Systems Design and Services: 28%  
12. Higher Education: 26%  
13. Energy: 17%
A bar chart titled "No-Code AI Builder Tools" from Stack Overflow, asking, "Which of the following no-code AI builder tools have you used in the past year for work or want to use in the future?" The chart compares percentages of "Have used" (yellow bars) and "Want to use" (green bars) for various tools:

1. Replit: 35% (used), 52% (want to use)  
2. Lovable: 35% (used), 39% (want to use)  
3. Base44: 14% (used), 26% (want to use)  
4. Langflow: 12% (used), 26% (want to use)  
5. Stack AI: 10% (used), 24% (want to use)  
6. Glue: 2% (used), 24% (want to use)  
7. v0: 19% (used), 22% (want to use)  
8. Botflow: 13% (used), 22% (want to use)  
9. Create: 6% (used), 22% (want to use)  
10. Rivet: 3% (used), 20% (want to use)  
11. Flowise: 7% (used), 17% (want to use)  
12. Sparkles: 3% (used), 17% (want to use)  
13. Relevance AI: 6% (used), 15% (want to use)  
14. Voiceflow: 5% (used), 15% (want to use)  
15. Botpress: 3% (used), 15% (want to use)  
16. Pickaxe: 3% (used), 15% (want to use)  
17. Wordware: 2% (used), 15% (want to use)  
18. MarbleML: 1% (used), 13% (want to use)

Preference for agent tools overall goes to coding tools that have been around since agentic AI started to become more established in late 2024/early 2025:

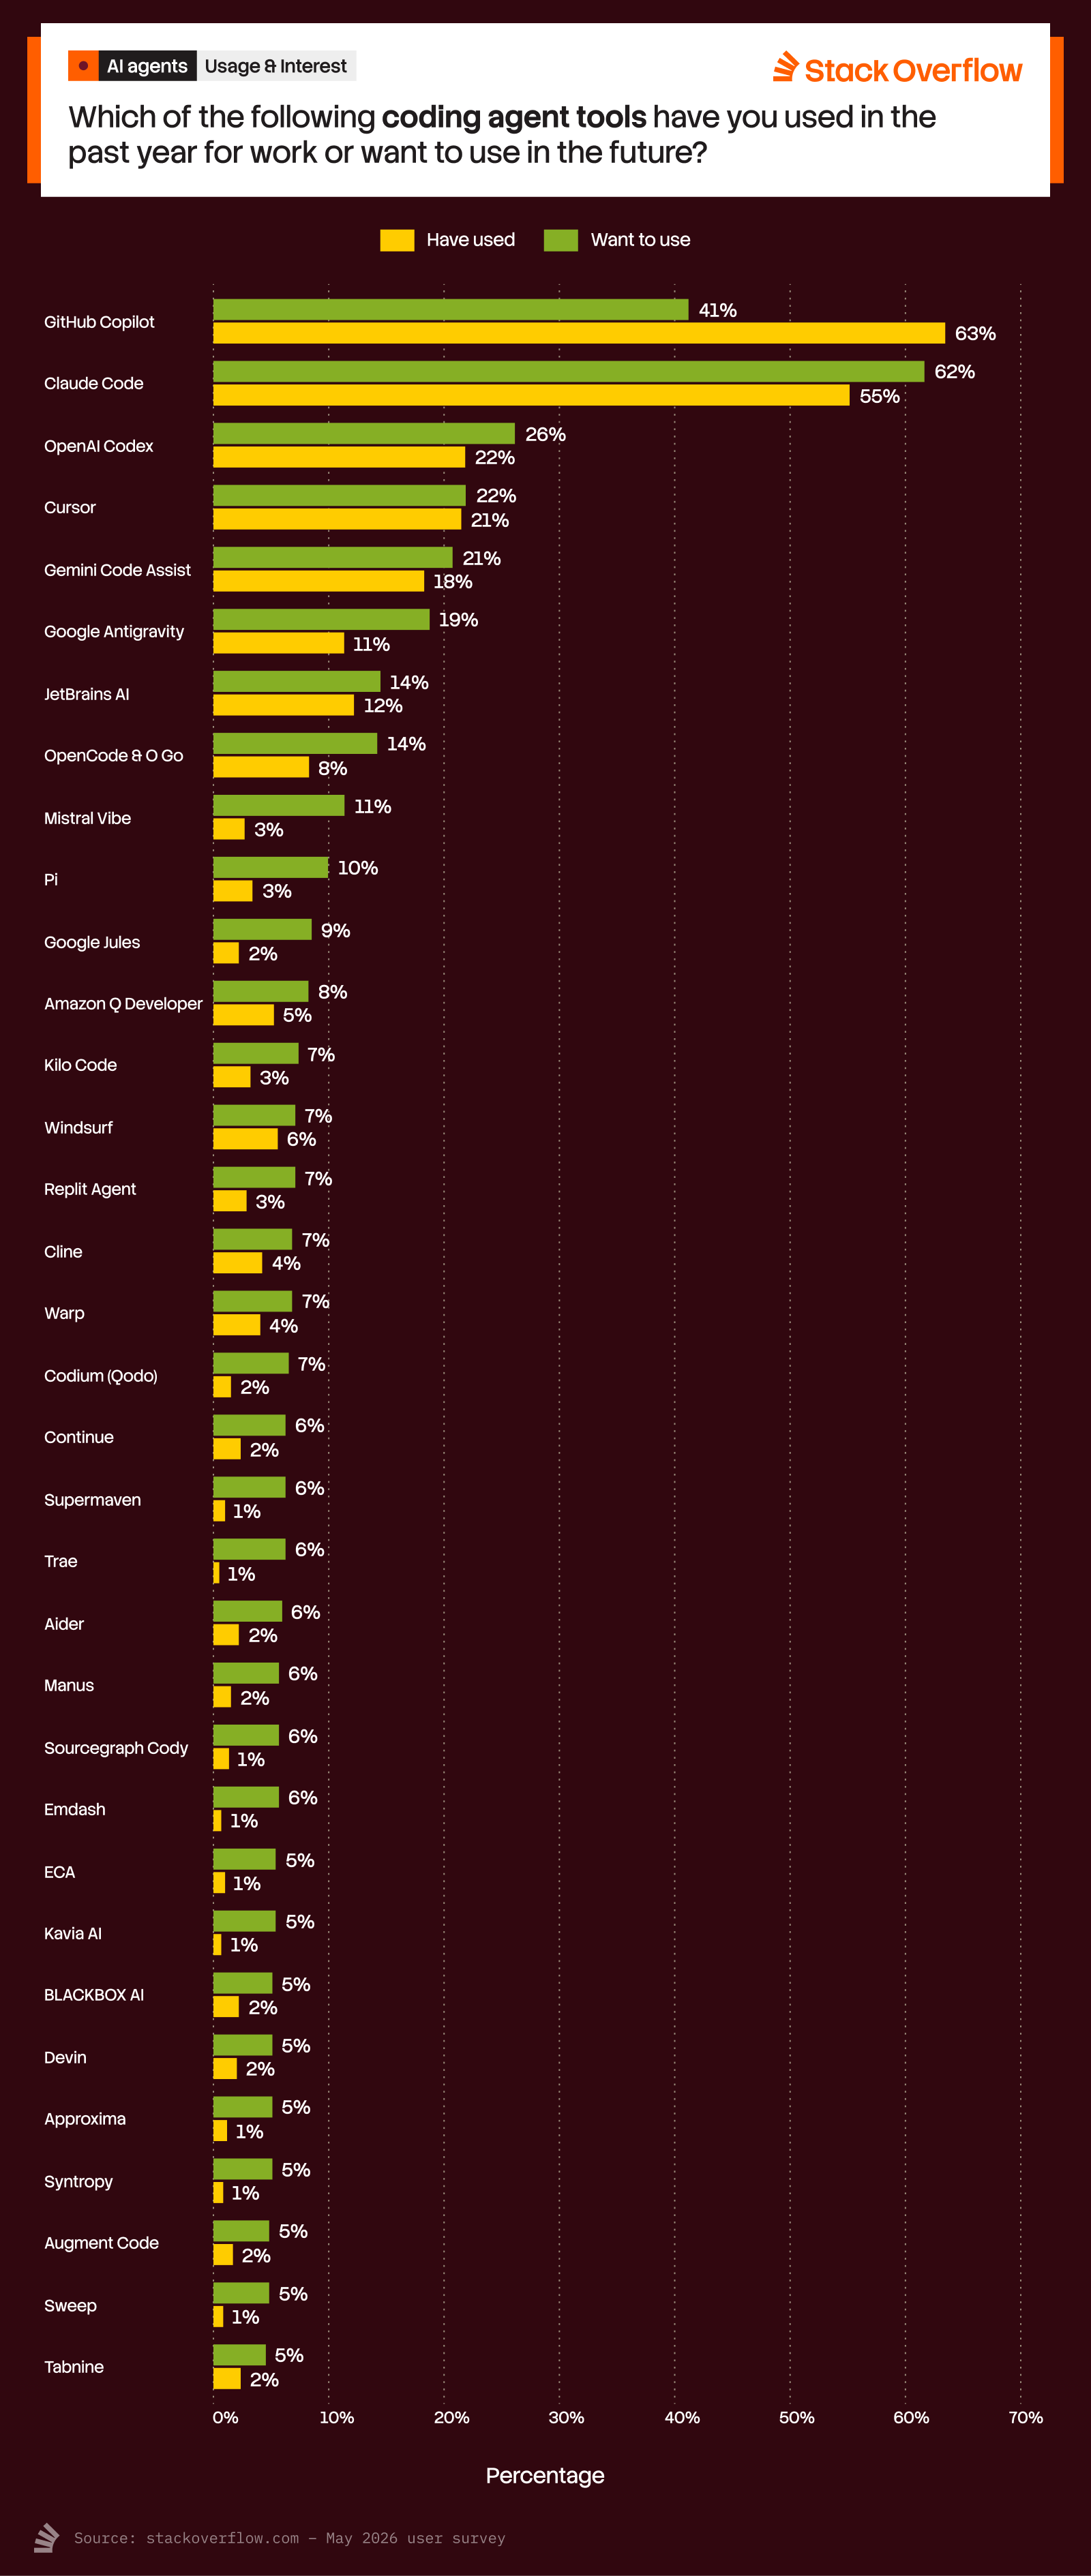
  • Code assistants: GitHub Copilot (61%), Claude Code (51%), OpenAI Codex (20%), and Cursor (20%) are the most used in the last six months. Respondents indicated they want to use these tools the most in the next six months, as well, with Google Code Assist getting as much traction as Cursor (13%).
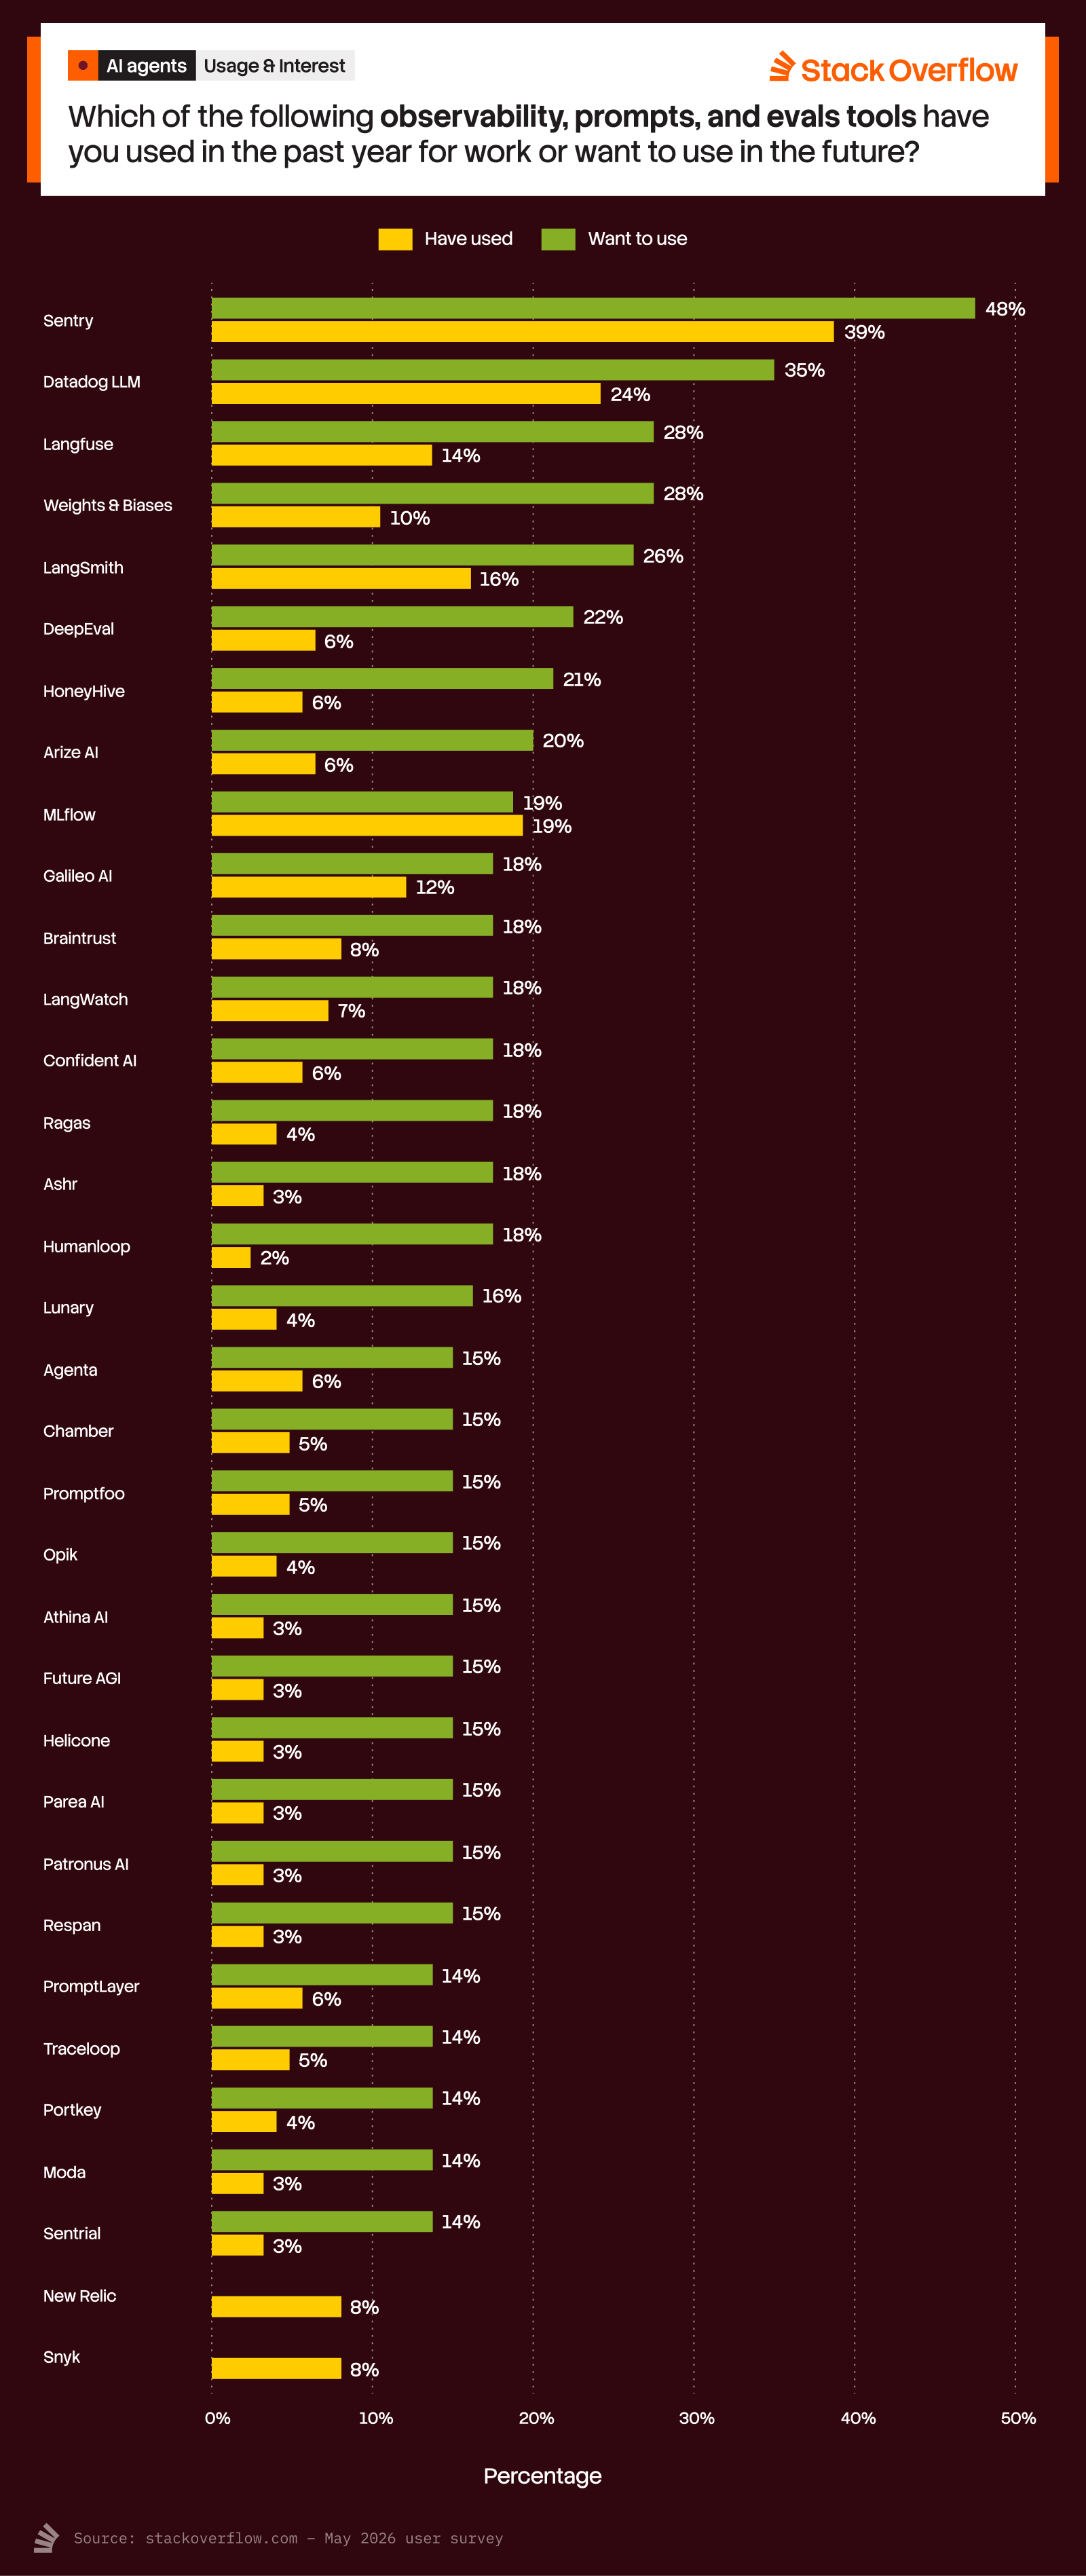
  • Agent observability: Most users indicated wanting to use a tool more than they had indicated actual use. Among agent observability tools, Sentry was both the most-used tool over the last six months and the tool respondents most wanted to use over the next six months (29%). Users also indicate wanting to use Datadog LLM (21%), Langfuse (17%), and Weights & Biases (17%) in the next six months.
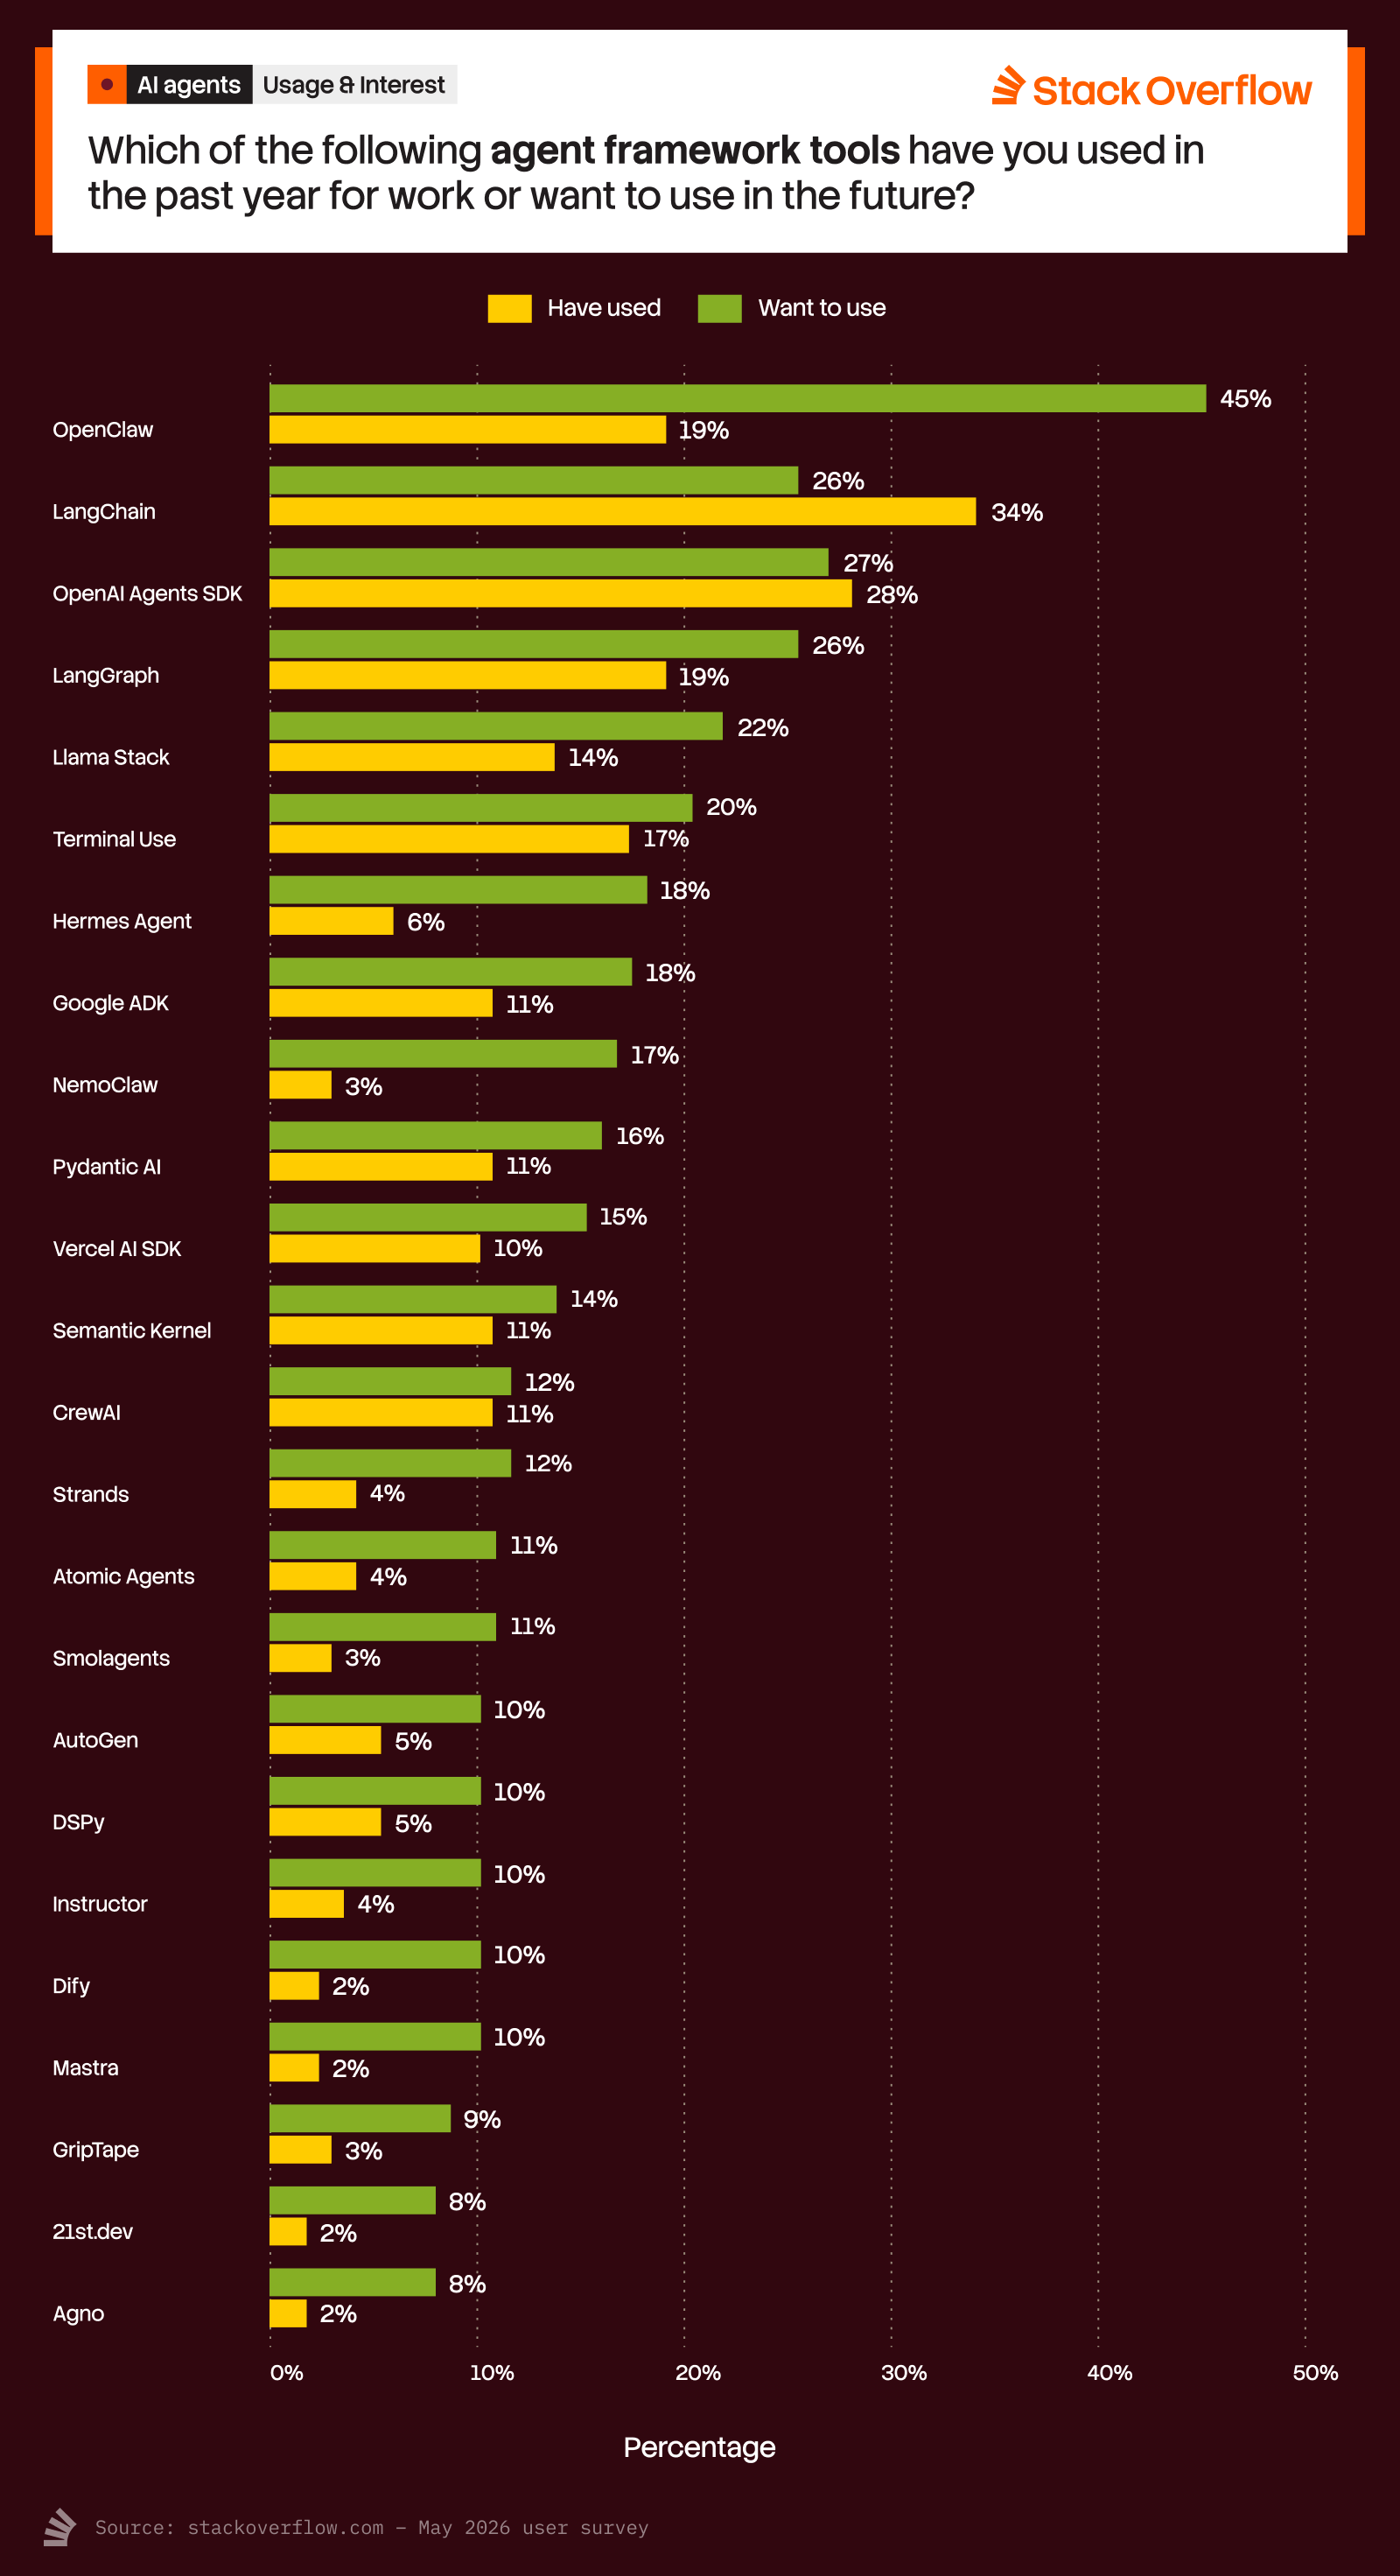
  • For agent frameworks, LangChain (22%) and LangGraph (14%) are the top tool choices among well-settled tools in the agentic space. Newcomers that show high usage and high interest are OpenClaw (17% have used, 32% want to use), OpenAI Agents SDK (14% have used, 19% want to use), and Terminal Use (15% have used, 15% want to use).

A glimpse into this year’s Developer Survey

Agents may be the future of technology (or not). While fewer people see cost as a barrier, it remains a major factor with agents for the time being. Anthropic just updated their policy for subscribers who run up inference costs with agentic assistants like Openclaw. GitHub Copilot also announced new subscriber usage costs on top of subscription costs. Ramp continues to show the data doesn’t lie when it comes to corporate AI spend.

We are excited to bring all the insights together again for this year's annual Developer Survey. Rather than opening it in May this year, we are waiting a few weeks to get more of the growing community of technologists involved. While we wait, we have opened up an open-source GitHub repo for last year’s survey (with every year of Developer Survey data) for anyone who wants to get deep into the questions and submit feedback for this year. For those who want to know more about the Developer Survey, make sure to follow our blog where we will post all the latest updates.
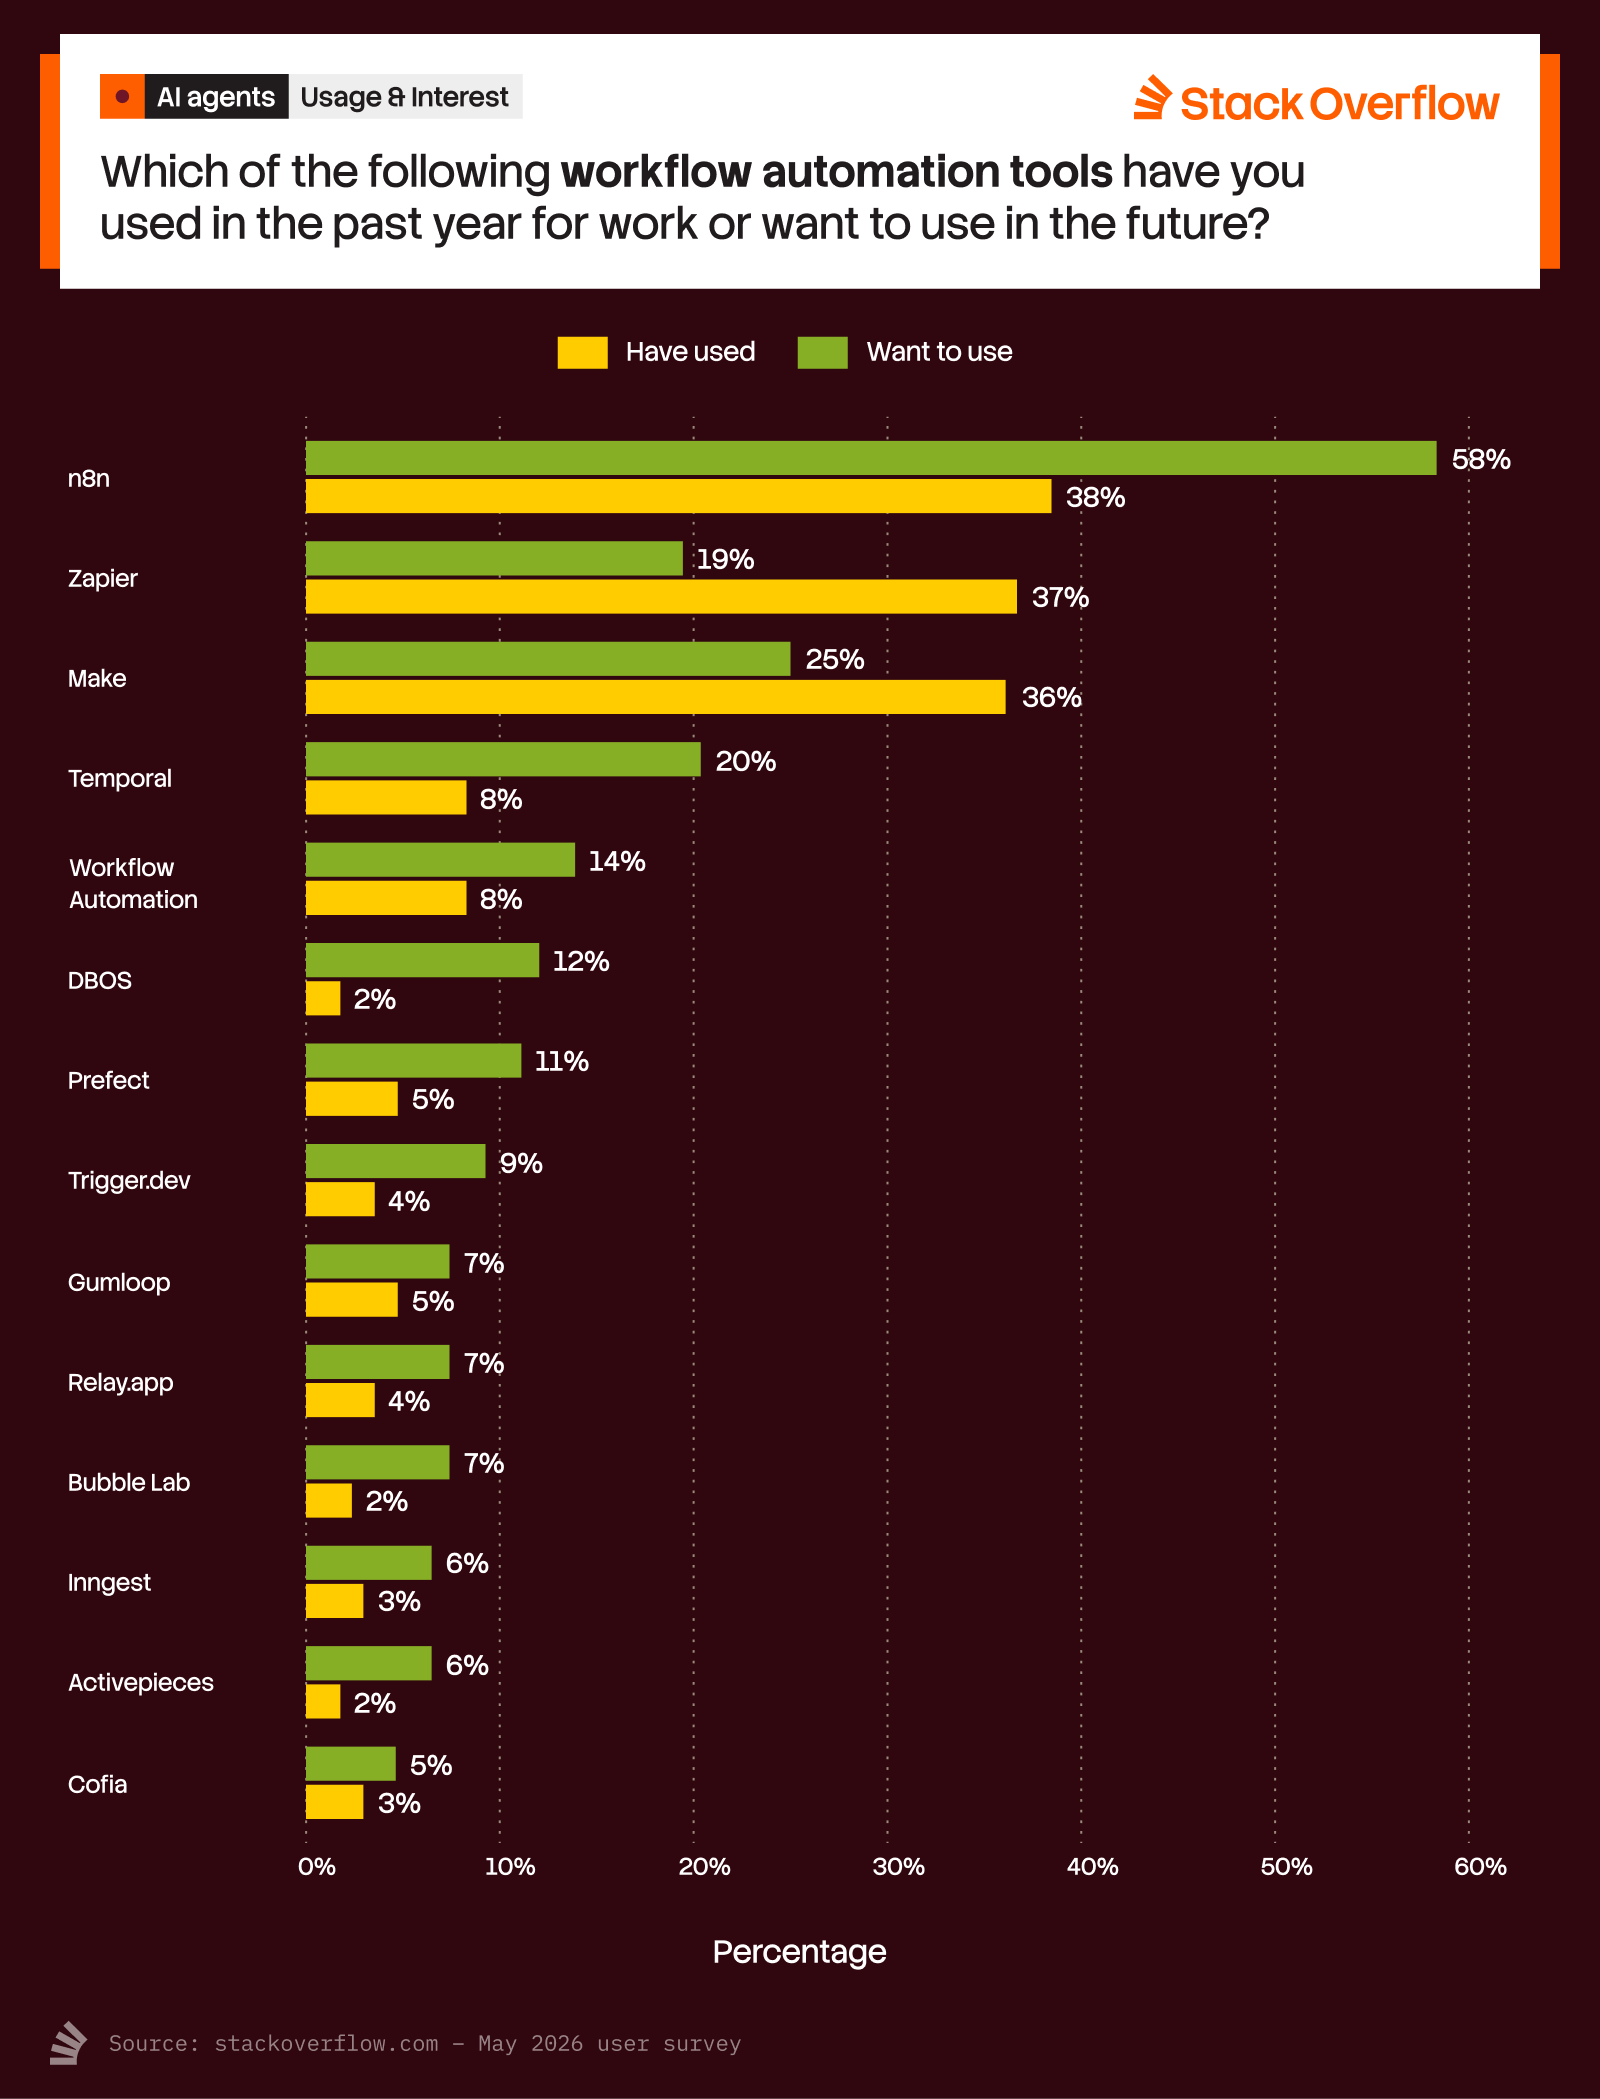
A bar chart titled "Workflow Automation Tools" from Stack Overflow, asking, "Which of the following workflow automation tools have you used in the past year for work or want to use in the future?" The chart compares percentages of "Have used" (yellow bars) and "Want to use" (green bars) for various tools:

1. n8n: 38% (used), 58% (want to use)  
2. Zapier: 19% (used), 37% (want to use)  
3. Make: 25% (used), 36% (want to use)  
4. Temporal: 8% (used), 20% (want to use)  
5. Workflow Automation: 8% (used), 14% (want to use)  
6. DBOS: 2% (used), 12% (want to use)  
7. Prefect: 5% (used), 11% (want to use)  
8. Trigger.dev: 4% (used), 9% (want to use)  
9. Qumloop: 5% (used), 7% (want to use)  
10. *Relay.app:* 4% (used), 7% (want to use)  
11. Bubble Lab: 2% (used), 7% (want to use)  
12. Inngest: 3% (used), 6% (want to use)  
13. Activepieces: 2% (used), 6% (want to use)  
14. Coflo: 5% (used), 3% (want to use)
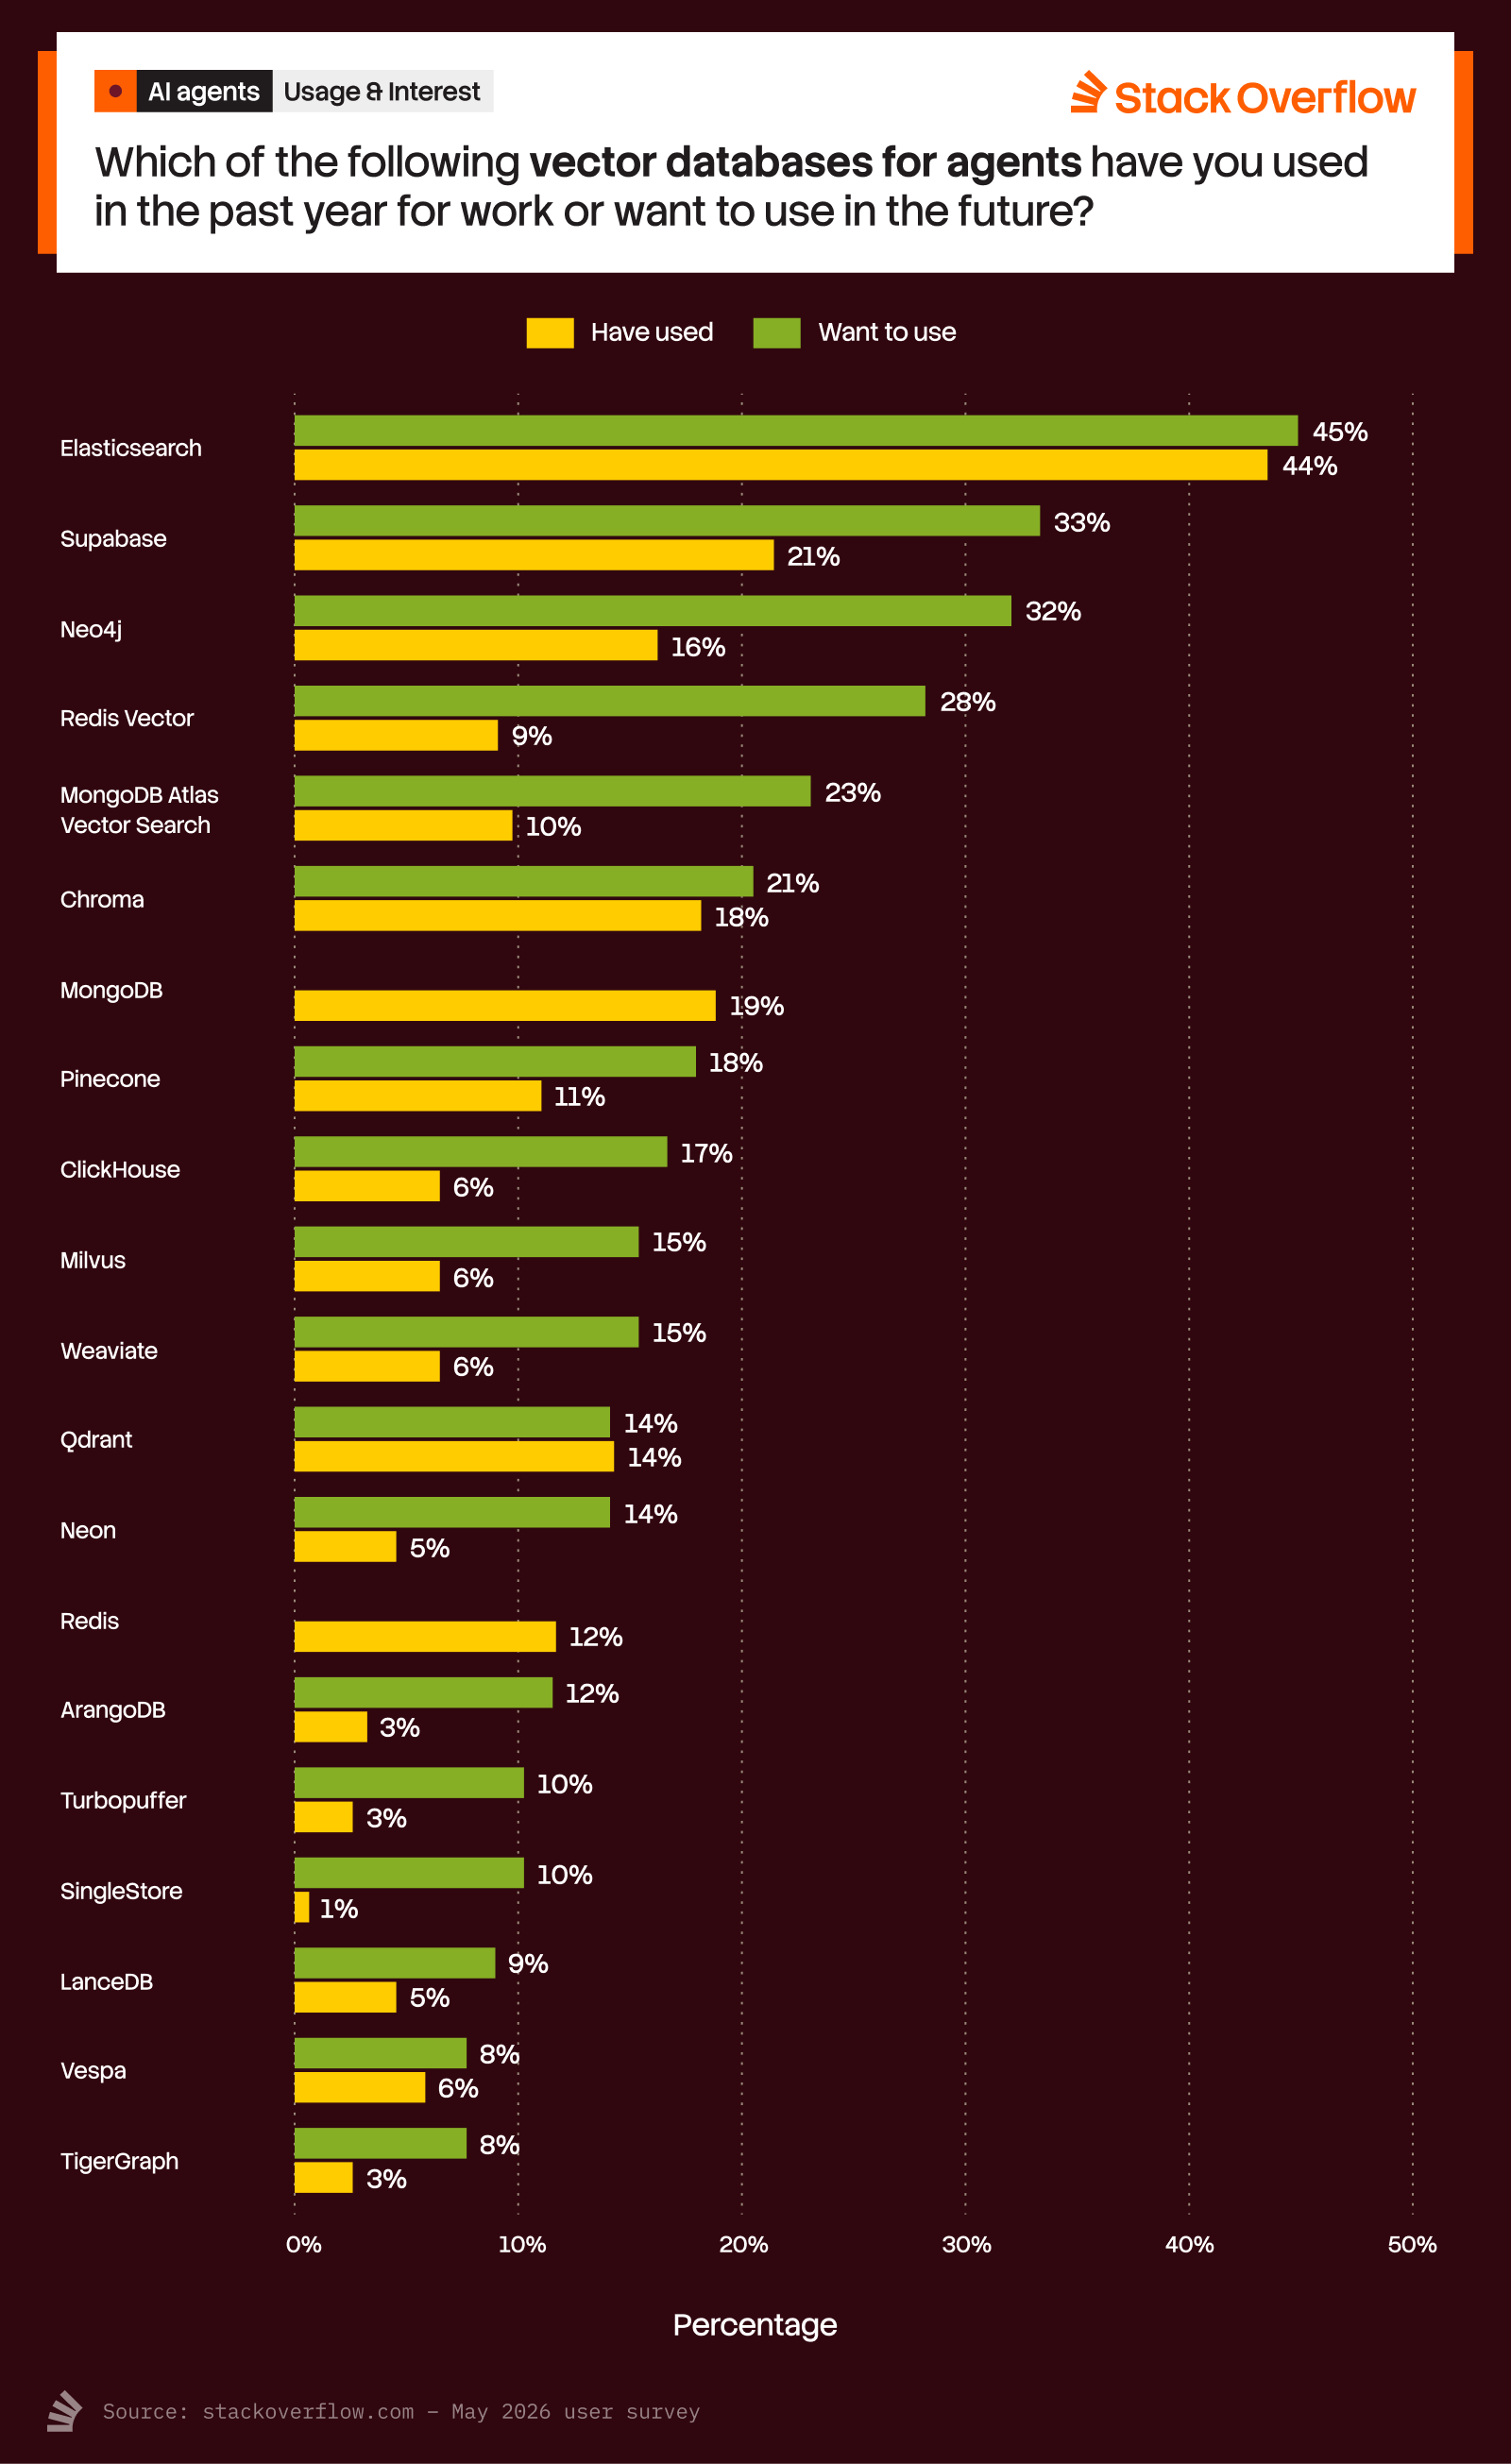
A bar chart titled "Vector Databases for Agents" from Stack Overflow, asking, "Which of the following vector databases for agents have you used in the past year for work or want to use in the future?" The chart compares percentages of "Have used" (yellow bars) and "Want to use" (green bars) for various databases:

1. Elasticsearch: 45% (used), 44% (want to use)  
2. Supabase: 21% (used), 33% (want to use)  
3. Neo4j: 16% (used), 32% (want to use)  
4. Redis Vector: 9% (used), 28% (want to use)  
5. MongoDB Atlas Vector Search: 10% (used), 23% (want to use)  
6. Chroma: 18% (used), 21% (want to use)  
7. MongoDB: 19% (used), 19% (want to use)  
8. Pinecone: 11% (used), 18% (want to use)  
9. ClickHouse: 6% (used), 17% (want to use)  
10. Milvus: 6% (used), 15% (want to use)  
11. Weaviate: 6% (used), 15% (want to use)  
12. Qdrant: 14% (used), 14% (want to use)  
13. Neon: 5% (used), 14% (want to use)  
14. Redis: 12% (used), 12% (want to use)  
15. ArangoDB: 3% (used), 10% (want to use)  
16. Turbopuffer: 3% (used), 10% (want to use)  
17. SingleStore: 1% (used), 10% (want to use)  
18. LanceDB: 5% (used), 9% (want to use)  
19. Vespa: 6% (used), 8% (want to use)  
20. TigerGraph: 3% (used), 8% (want to use)
A bar chart titled "Observability, Prompts, and Evals Tools" from Stack Overflow, asking, "Which of the following observability, prompts, and evals tools have you used in the past year for work or want to use in the future?" The chart compares percentages of "Have used" (yellow bars) and "Want to use" (green bars) for various tools:

1. Sentry: 39% (used), 48% (want to use)  
2. Datadog LLM: 24% (used), 35% (want to use)  
3. Langfuse: 14% (used), 28% (want to use)  
4. Weights & Biases: 10% (used), 28% (want to use)  
5. LangSmith: 16% (used), 26% (want to use)  
6. DeepEval: 8% (used), 22% (want to use)  
7. HoneyHive: 6% (used), 21% (want to use)  
8. Arize AI: 8% (used), 20% (want to use)  
9. MLflow: 19% (used), 19% (want to use)  
10. Galileo AI: 12% (used), 18% (want to use)  
11. Braintrust: 8% (used), 18% (want to use)  
12. LangWatch: 7% (used), 18% (want to use)  
13. Confident AI: 6% (used), 18% (want to use)  
14. Rogas: 4% (used), 18% (want to use)  
15. Ashr: 3% (used), 18% (want to use)  
16. Humanloop: 2% (used), 18% (want to use)  
17. Lunary: 4% (used), 16% (want to use)  
18. Agenta: 6% (used), 15% (want to use)  
19. Chamber: 5% (used), 15% (want to use)  
20. Promptfoo: 5% (used), 15% (want to use)  
21. Opik: 4% (used), 15% (want to use)  
22. Athina AI: 3% (used), 15% (want to use)  
23. Future AGI: 3% (used), 15% (want to use)  
24. Helicone: 3% (used), 15% (want to use)  
25. Parea AI: 3% (used), 15% (want to use)  
26. Patronus AI: 3% (used), 15% (want to use)  
27. Respan: 3% (used), 15% (want to use)  
28. PromptLayer: 6% (used), 14% (want to use)  
29. Traceloop: 5% (used), 14% (want to use)  
30. Portkey: 4% (used), 14% (want to use)  
31. Moda: 3% (used), 14% (want to use)  
32. Sentrail: 3% (used), 14% (want to use)  
33. New Relic: 8% (used), no data for "want to use"  
34. Snyk: 8% (used), no data for "want to use"
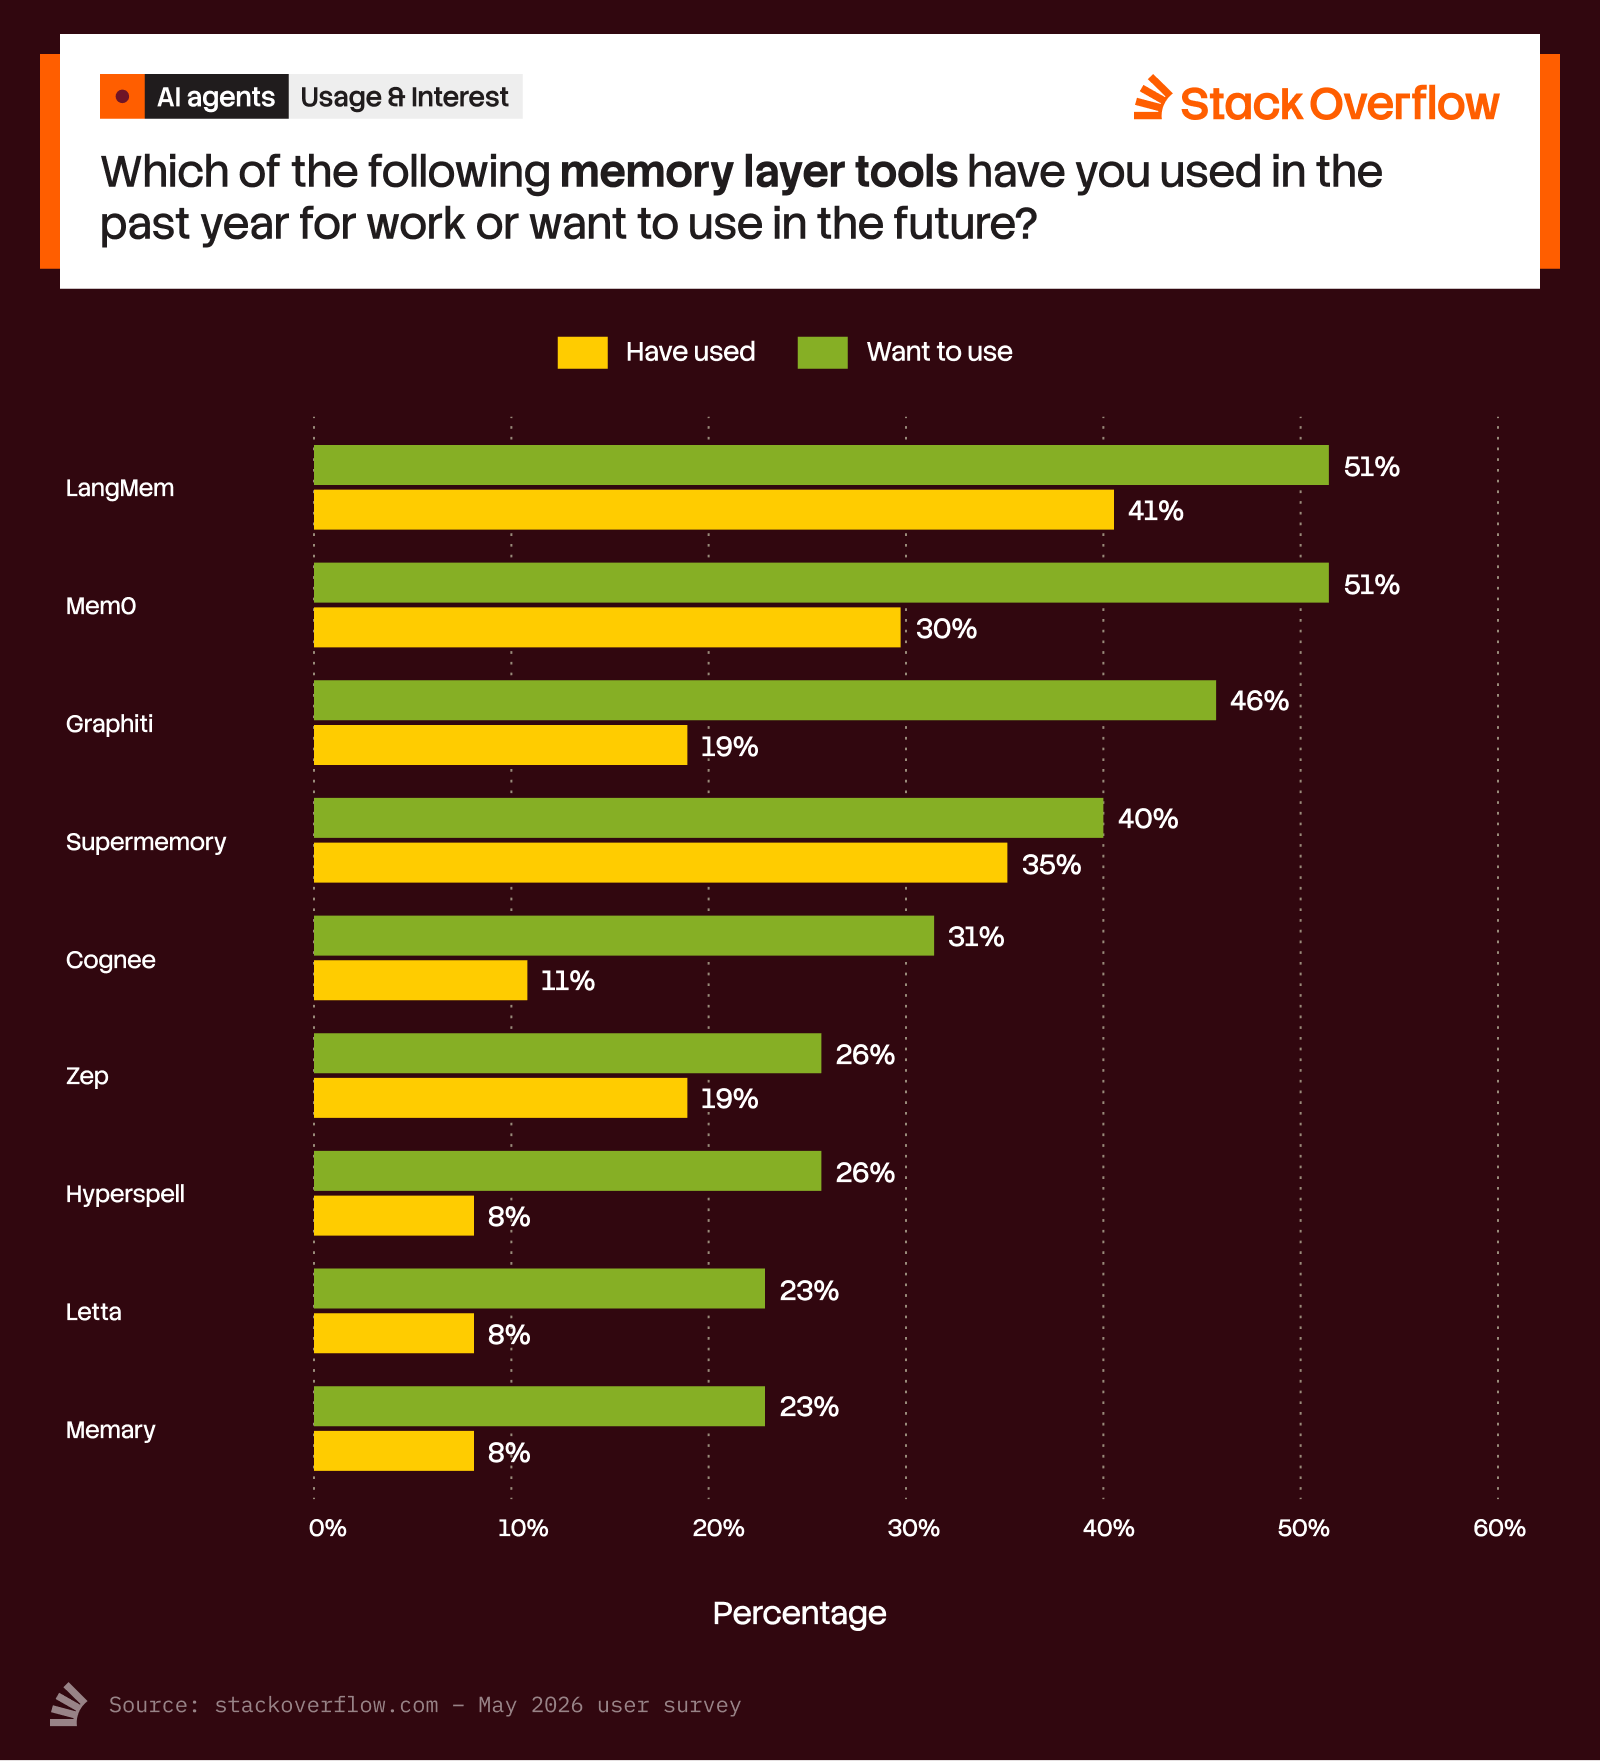
A bar chart titled "Memory Layer Tools" from Stack Overflow, asking, "Which of the following memory layer tools have you used in the past year for work or want to use in the future?" The chart compares percentages of "Have used" (yellow bars) and "Want to use" (green bars) for various tools:

1. LangMem: 41% (used), 51% (want to use)  
2. Mem0: 30% (used), 51% (want to use)  
3. Graphiti: 19% (used), 46% (want to use)  
4. Supermemory: 35% (used), 40% (want to use)  
5. Cognée: 11% (used), 31% (want to use)  
6. Zep: 19% (used), 26% (want to use)  
7. Hyperspell: 8% (used), 26% (want to use)  
8. Letta: 8% (used), 23% (want to use)  
9. Memary: 8% (used), 23% (want to use)
A bar chart titled "Coding Agent Tools" from Stack Overflow, asking, "Which of the following coding agent tools have you used in the past year for work or want to use in the future?" The chart compares percentages of "Have used" (yellow bars) and "Want to use" (green bars) for various tools:

1. GitHub Copilot: 41% (used), 63% (want to use)  
2. Claude Code: 26% (used), 62% (want to use)  
3. OpenAI Codex: 22% (used), 56% (want to use)  
4. Cursor: 22% (used), 22% (want to use)  
5. Gemini/Code Assist: 21% (used), 21% (want to use)  
6. Google Antigravity: 18% (used), 19% (want to use)  
7. JetBrains AI: 14% (used), 14% (want to use)  
8. OpenCode (aka OpenCode Go): 8% (used), 14% (want to use)  
9. Mistral Vibe: 3% (used), 11% (want to use)  
10. Pi: 3% (used), 10% (want to use)  
11. Google Jules: 2% (used), 9% (want to use)  
12. Amazon Q Developer: 2% (used), 8% (want to use)  
13. Kilo Code: 6% (used), 7% (want to use)  
14. Windsurf: 3% (used), 7% (want to use)  
15. Replit Agent: 6% (used), 7% (want to use)  
16. Cline: 3% (used), 7% (want to use)  
17. Warp: 4% (used), 7% (want to use)  
18. Codium (Odoo): 2% (used), 6% (want to use)  
19. Continue: 2% (used), 6% (want to use)  
20. Supermaven: 1% (used), 6% (want to use)  
21. Tree: 1% (used), 6% (want to use)  
22. Alder: 2% (used), 6% (want to use)  
23. Manus: 2% (used), 6% (want to use)  
24. Sourcegraph Cody: 1% (used), 6% (want to use)  
25. Emdash: 1% (used), 5% (want to use)  
26. ECA: 1% (used), 5% (want to use)  
27. Kavia AI: 1% (used), 5% (want to use)  
28. BLACKBOX AI: 2% (used), 5% (want to use)  
29. Devin: 2% (used), 5% (want to use)  
30. Approxima: 1% (used), 5% (want to use)  
31. Syntropy: 1% (used), 5% (want to use)  
32. Augment Code: 2% (used), 5% (want to use)  
33. Sweep: 1% (used), 5% (want to use)  
34. Tabnine: 2% (used), 5% (want to use)
A bar chart titled "Agent Framework Tools" from Stack Overflow, asking, "Which of the following agent framework tools have you used in the past year for work or want to use in the future?" The chart compares percentages of "Have used" (yellow bars) and "Want to use" (green bars) for various tools:

1. OpenClaw: 19% (used), 45% (want to use)  
2. LangChain: 26% (used), 34% (want to use)  
3. OpenAI Agents SDK: 27% (used), 29% (want to use)  
4. LangGraph: 19% (used), 28% (want to use)  
5. Llama Stack: 14% (used), 22% (want to use)  
6. Terminal Use: 17% (used), 20% (want to use)  
7. Hermes Agent: 6% (used), 18% (want to use)  
8. Google ADK: 11% (used), 18% (want to use)  
9. NemoClaw: 11% (used), 17% (want to use)  
10. Pyandtic AI: 3% (used), 16% (want to use)  
11. Vercel AI SDK: 11% (used), 15% (want to use)  
12. Semantic Kernel: 10% (used), 14% (want to use)  
13. Crew AI: 12% (used), 12% (want to use)  
14. Strands: 4% (used), 12% (want to use)  
15. Atomic Agents: 4% (used), 11% (want to use)  
16. Smolagents: 3% (used), 11% (want to use)  
17. AutoGen: 5% (used), 10% (want to use)  
18. DSPy: 5% (used), 10% (want to use)  
19. Instructor: 4% (used), 10% (want to use)  
20. Dify: 2% (used), 10% (want to use)  
21. Mastra: 2% (used), 10% (want to use)  
22. GripTape: 3% (used), 9% (want to use)  
23. 21stdev: 2% (used), 8% (want to use)  
24. Agno: 2% (used), 8% (want to use)

Add to the discussion

Login with your stackoverflow.com account to take part in the discussion.