
We found in a previous post that Python has a solid claim to being the fastest-growing programming language in terms of Stack Overflow visits.
The same analysis showed that the R programming language has shown remarkable growth in the last five years as well. In fact, R is growing at a similar rate to Python in terms of a year-over-year percentage, though this growth is "easier" because it started from a smaller share of traffic.
In another post, we found that much of the growth of Python can be explained by the expansion of data science. Since R is primarily used for statistical analysis, it's likely that R is part of the same trend. In this post, we'll analyze how quickly R has grown, examine how its growth differs across industries, and look at what R packages are popular and growing within the ecosystem.
Like Python, a disproportionate amount of traffic to R questions comes from high-income countries (it's visited about three times as often in those countries as in the rest of the world), so this post will consider Stack Overflow traffic from high-income countries, such as the United States, United Kingdom, Germany, Canada and France. As a disclaimer, we'll note that the Data Team at Stack Overflow works primarily in R (in fact, we use it to generate almost all of the graphs and results for Insights posts like this one).
Growth of R
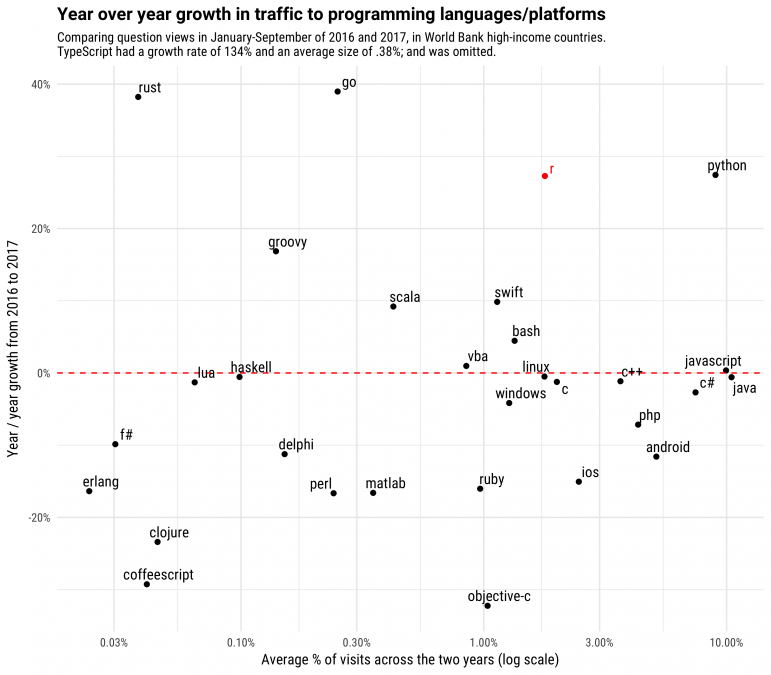
Our previous post about Python's growth considered visits to Python compared to five other major programming languages (Java, JavaScript, C#, PHP, and C++) that each make up a substantial share of Stack Overflow question visits. R makes up a smaller share than those tags, so we'll compare its growth to languages of a similar size.
There is no sense in which R is "competing" with any of these other languages, which aren't typically used for data analysis. This comparison is shown only to demonstrate that the kind of sustained growth R has shown is rare among languages of comparable size.
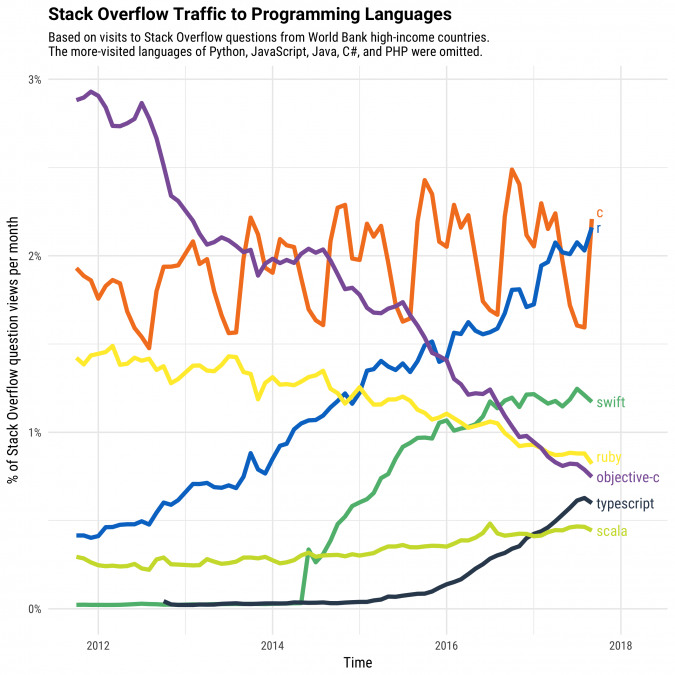
Traffic to C questions shows a strong seasonal pattern (since it's one of the most common choices for undergraduate programming classes), and R has roughly caught up with that level of traffic. Visits to Swift questions grew rapidly after Apple introduced the language in 2014, but have since leveled off. Typescript, though it's still a smaller source of traffic, has been showing quite remarkable growth, and will be the subject of some future analyses. As we saw in a previous post, traffic to Ruby and especially to Objective C have been declining over time.
Projecting future growth of Stack Overflow visits can be tricky, but according to an STL model it's reasonable to predict that R will be the seventh most visited programming language tag from high-income countries in 2018, after Python, Java, JavaScript, C#, PHP, and C++.
By industry
What industries visit R questions the most? (This analysis is restricted to the United States and United Kingdom, the countries in which we can segment our traffic by industry).
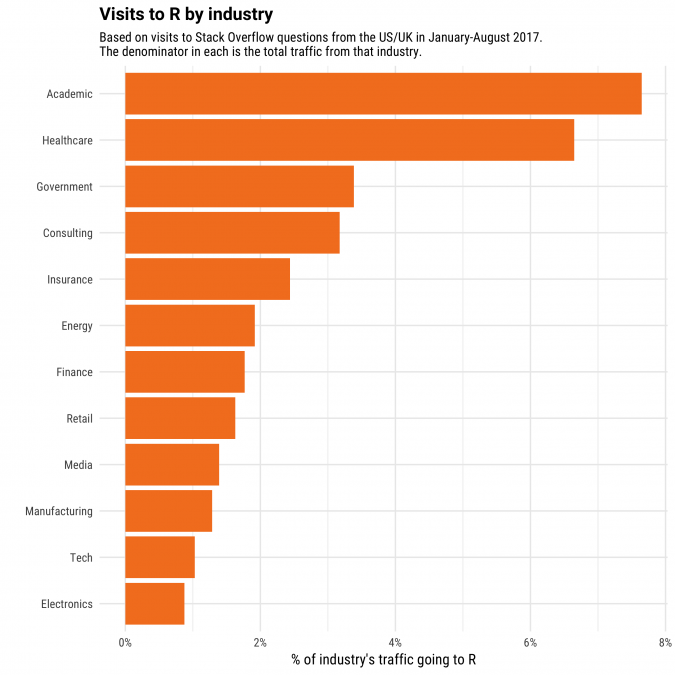
R is most visited from universities, where it's a common choice for academic research, especially in the social sciences and biology. Indeed, in June-July 2017, when most classes aren't in session, R was the second-most visited tag from universities, second only to Python.
The industry with the second-highest share of R visitors, by a close margin, is healthcare. That probably won't come as a surprise to biostatisticians, since R is the tool of choice for many statistical methods necessary for clinical studies and bioinformatics.
One industry that doesn't visit a lot of R, relative to other technologies, is tech: software and web companies. (The Data Team here at Stack Overflow is one exception!) This is partly because data analysis makes up a relatively small portion of the industry's Stack Overflow visits, compared to software and web development. We separately found that pandas, a data science framework for Python, was less visited in tech than it was in almost all other industries. But it does suggest that the way we use R on our team is not the typical use case for the language.
We saw that Python's rate of growth has been roughly equal across all industries we can measure. In what industries is R growing the fastest?
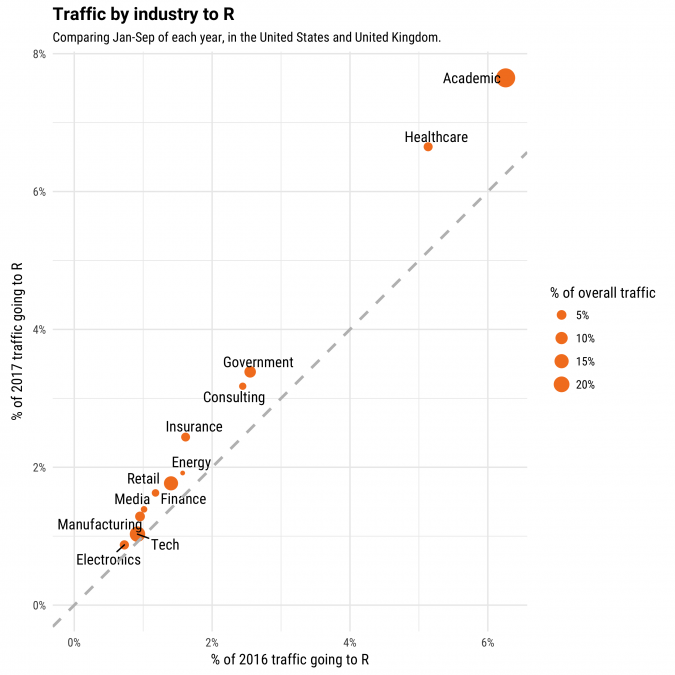
R isn't shrinking within any industry, but visits to R are generally growing faster in industries where it was already more heavily visited, including showing very rapid growth in academia and healthcare. This graph also confirms what we saw in a previous analysis, that R is both disproportionately visited and fast-growing in the government sector. We also see that it's relatively widely used, and expanding, in consulting and insurance. Each of these are industries where data analysis and visualization play a disproportionate role, relative to software and web development.
One of the areas where we don't see much growth is tech, confirming that most of R's expansion appears to be happening outside of the software and web industry. Since in that industry we did see an increase in visits to Python data science frameworks like pandas and NumPy, it's a reasonable conclusion that Python is becoming a more popular choice for data science within those companies.
R Packages
In the case of Python, we were interested in what particular applications of the language had been driving its growth, such as data science, web development, and system administration. R is less of a mystery: its primary purpose has always been statistical analysis, machine learning, and data visualization. But we're still interested in what trends are happening within the R ecosystem.
To examine this, we extracted what R packages were used in particular questions and answers. We extracted this from our public R Questions dataset hosted on Kaggle, containing all (non-deleted) questions and answers with the R tag. This Kaggle kernel shows how we parsed the data, including examining uses of the library() and require() functions.
What were the most commonly used packages, in all existing R questions and answers?
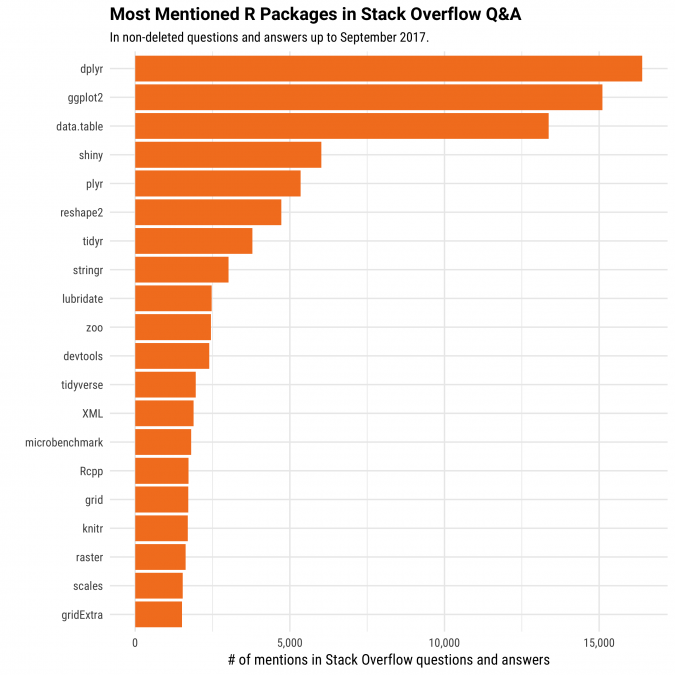
Many of the most commonly mentioned packages were written by Hadley Wickham, with his packages making up 7 of the top 10 (the others being data.table, shiny, and zoo). It's worth noting that this metric may be tilted towards the most confusing packages rather than simply the most widely used. However, running this on the most common packages mentioned in answers, not just questions, leads to a very similar list (you can try it yourself!), meaning this is a reasonably faithful representation of the packages R developers find useful in their work.
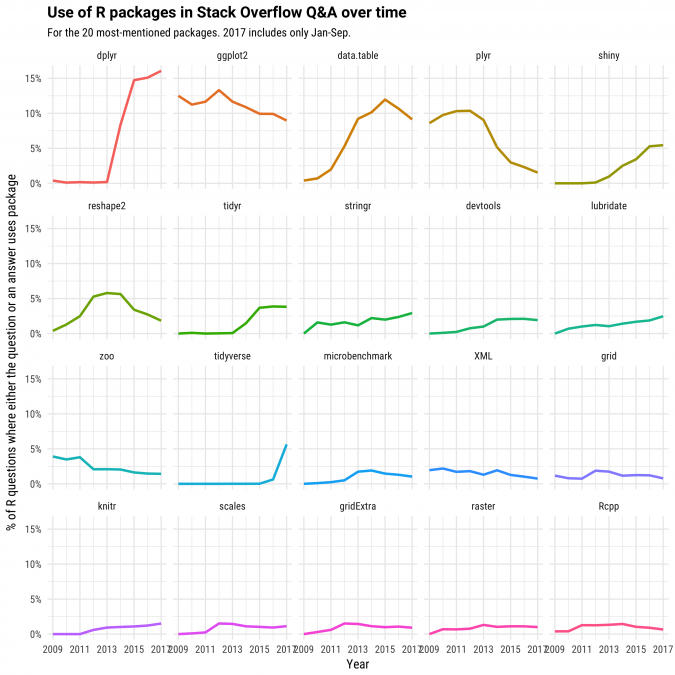
This data can also give us insight into the fastest growing packages. We'll measure this over time in terms of the percentage of questions where either the question mentions the package, or one of its answers does. Since R questions in general are becoming more common, we're examining the changes only as a share of the R ecosystem: most of these packages are growing in terms of raw numbers.
(Note that in some very rare cases packages were edited into older questions or answers, which allows them to "appear" before the package was released).
We can observe some trends in the use of R packages. For example:
- ggplot2 has always been involved in a substantial portion of questions and answers, though its frequency has been slightly declining since the early years of the site.
- The data.table and especially dplyr packages showed rapid growth during Stack Overflow's lifetime, which has leveled off in the last two years. The interactive web framework Shiny has also shown some substantial growth since its introduction in 2012.
- We can see changes in common tools for solving problems. The plyr and reshape2 packages rose in frequency from about 2009 to 2013, then declined afterwards when Wickham replaced them with the newer dplyr and tidyr packages.
- Older packages like zoo, xml, and grid have been steady or slowly declining as a share of questions.
Another way to visualize growth is to lay out R packages in a network, based on what pairs of packages tended to be used in Stack Overflow answers on the same questions. This gives a sense of what groups of packages tend to solve similar problems. What areas of R package development have recently grown in their share of questions and answers?
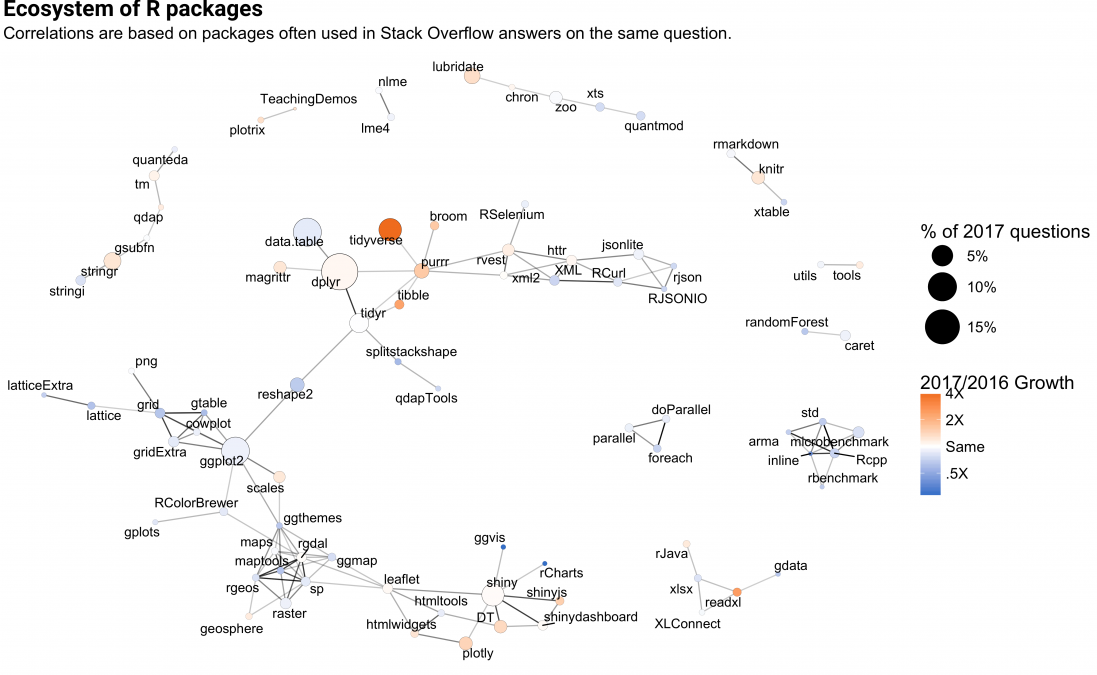
This lays out the ecosystem of R packages based on a few smaller subnetworks. Visualization packages generally ended up on the lower left, largely splitting into three clusters: grid graphics (centered around ggplot2), geographical visualization (including the sp, maps and maptools packages) and interactive visualization (with shiny, plotly, DT and htmlwidgets making up some of the more notable nodes). In the center of the ecosystem we see a cluster for data transformation, including dplyr, data.table, and purrr. Other clusters are characterized by text manipulation (stringr, tm), performance optimization (Rcpp, microbenchmark) and time series (lubridate, zoo).
By the definition we chose, most "growth" is centered in newer packages that have plenty of room to grow, such as the tidyverse package (introduced only last year). That means blue regions of the ecosystem don't represent "stagnant" areas, but rather regions that have already had their share of questions asked. Still, it's interesting to see that by this definition, two major areas of growth in the ecosystem are data transformation and interactivity. We'd generally agree from our experience in the R community that these are two areas with lots of recent innovation.
Conclusion
Since we use R on the Stack Overflow Data Team, we certainly enjoyed examining how the R ecosystem is changing, and seeing that it's been a part of the rapid expansion of the data science field. In general, the number of users of a language isn't directly related to its popularity. But the large and fast-growing community around the R language has certainly contributed to its value as a programming language and as a data analysis environment.
If you use R, and are looking to take the next step in your career, here are some companies hiring R programmers and data scientists right now on Stack Overflow Jobs.