
Amazon is a technology behemoth, employing half a million people globally and hiring nearly 130,000 people in 2017. Amazon has been headquartered in Seattle since its early days in the 1990s, but in September 2017, the company announced a search for a secondary headquarters elsewhere in North America. Over 200 cities entered bids to be considered, and last month, Amazon announced a list of 20 finalists. What goes into this kind of choice? Amazon says it wants a city with more than one million residents, access to an airport, and decent commutes. Here at Stack Overflow, we can offer a different view on the question. Software developers in different locations have different average profiles. For example, they use proportionally more or less of different languages and technologies. We have explored these themes on our blog before, whether it was comparing four large cities or digging into what mobile development looks like across the world. We can use our knowledge of what software developers are like across North America to say which of these finalist cities would be the best fit for Amazon. Amazon could choose a city similar to its current Seattle headquarters in terms of software developer tools and experience, or they could choose a city that is different if it wants to grow other parts of its software workforce.
Most similar cities overall
To start with, we can look for the cities most similar to Seattle among the 20 candidate locations. Seattle is an interesting city to examine in an analysis like this because while this metro area is indeed the home of Amazon, it is also the home of another technology giant. In this analysis, I used geolocation (based on IP addresses) of our users to associate them with the 20 finalist cities/regions. I examined how strongly the presence of Microsoft affects the conclusions we can draw by either including or excluding Redmond, WA and the regions right around it from the "Seattle" definition. It turns out it makes quite a difference! I can see arguments for and against including Redmond here, depending on one's particular analytical purposes. My main focus here is to understand the Seattle tech ecosystem as it impacts Amazon, so for the rest of this analysis I am going to exclude Redmond and environs from the definition of Seattle. Once we have users associated with the 20 finalist cities, we can calculate a similarity between each city and Seattle. By "similarity" here, I mean a cosine similarity based on the mean percent of traffic to the top 500 Stack Overflow tags in these cities.
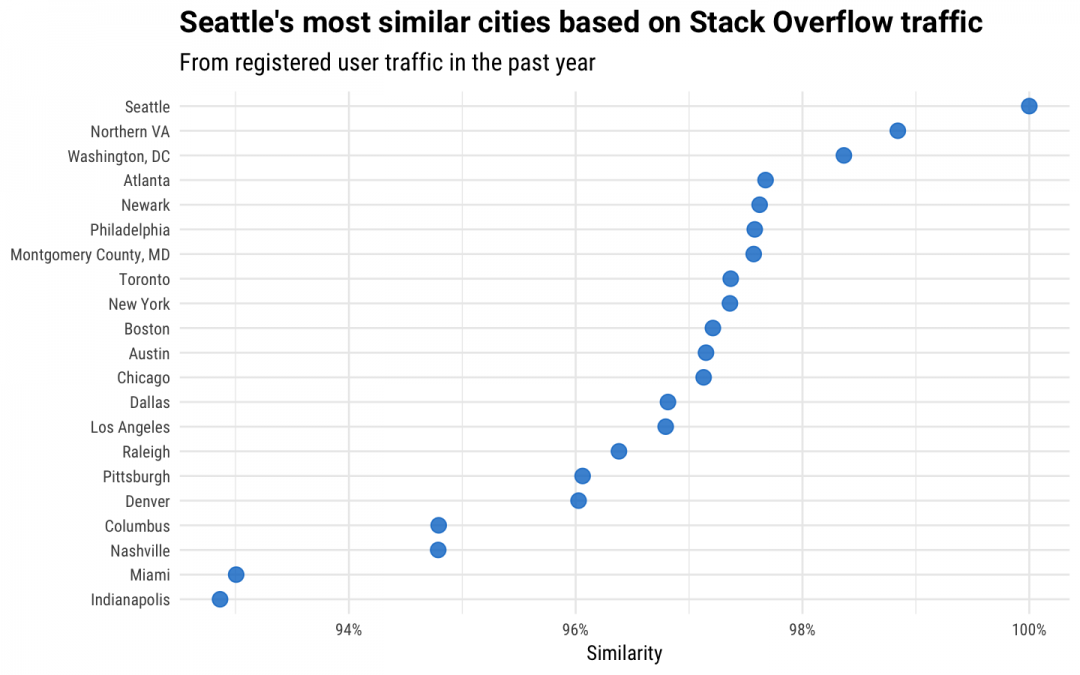
This analysis uses registered users only, and uses their traffic in the past year. We find that registered and unregistered users have similar traffic patterns, but we can more easily identify registered users and have higher quality data for them. You can see exactly what kind of data we store for you as a user, as well as out of predictions. We see in this plot that all of the options Amazon has identified as finalist cities are very similar to each other. If we added a city in Russia or India to this plot, we would see a significantly lower cosine similarity compared to these North American tech centers. Northern Virginia and Washington, DC are the most similar to Seattle in terms of the kinds of technologies that developers visit. Developers in Northern VA and Washington, DC visit a mix of technologies at proportions that are the closest to developers in Seattle (at least, the parts of Seattle that are not Redmond). There is another tier that is very close in similarity, and it includes Atlanta, Newark, Philadelphia, and Montgomery County. This is super interesting, but that isn't all we can learn from this kind of data. We can use statistical analysis to explore more.
Understanding developers using principal component analysis
We can use a statistical technique called principal component analysis to answer these kinds of questions. Developers who come to Stack Overflow don't visit tags in random combinations; the tags that any individual visits are related in ways that are connected to the kind of work that they do. Let's think of each Stack Overflow user as a point in a high-dimensional space with tags as the coordinates. Principal component analysis is a way to project these points (or users, in this case) onto a new, special coordinate system. In the new coordinate system, each coordinate, or principal component, is a weighted sum of tags/technologies. The first principal component has the most variance in users in its direction, the second principal component has the second most variance in users in its direction, and so forth.
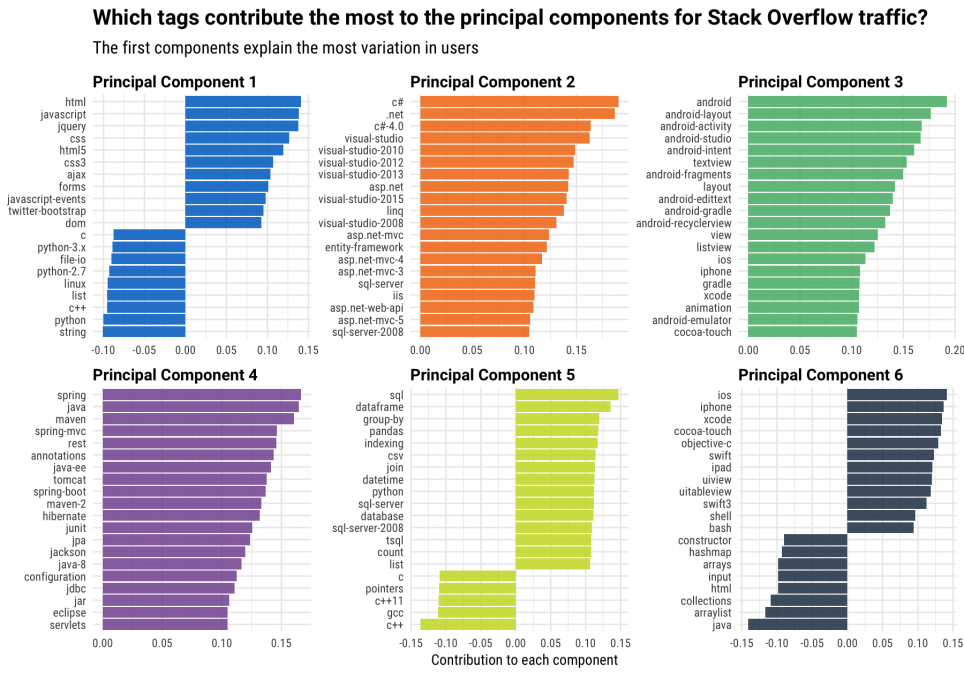
This plot shows the first six components or dimensions from principal component decomposition of registered traffic from the last year to Stack Overflow questions. Notice the combinations of tags that appear together in these different components.
- The first principal component, which explains the most variation in Stack Overflow users, contrasts users who visit a lot of front-end technologies (HTML, JavaScript, jQuery) with those who visit a lot of Python and/or low-level technologies like C++. When we look at all of our users, this spectrum from front-end to low-level and Python is what explains the most difference from one user to another.
- The second principal component, which explains the second largest amount of variation in Stack Overflow users, is not a contrast between two kinds of things, but instead is focused on one family of technologies- the Microsoft ecosystem of C#, .NET, Visual Studio, and related technologies. The characteristic of developers that explains the second most difference is whether or not they use these Microsoft technologies.
- The third principal component focuses on Android and iOS; this component measures to what extent a developer works building mobile apps.
- The fourth principal component is another single family, focused on Java, Spring, and Maven.
- The fifth principal component is back to a set of contrasts, and measures how much a developer works with C++ and C versus how much they work with SQL, databases, and perhaps some data handling with dataframes.
- The six principal component returns to iOS development for Apple devices, but instead of being partnered with Android like it was before, now it is contrasted with Java tags. This is a lower-rank principal component, so this difference explains less variation in users than the fourth principal component.
There are many principal components, each one less important than the one before in explaining differences between various users. This projection of traffic data into a new coordinate system allows us to draw conclusions about Amazon's candidate city choices.
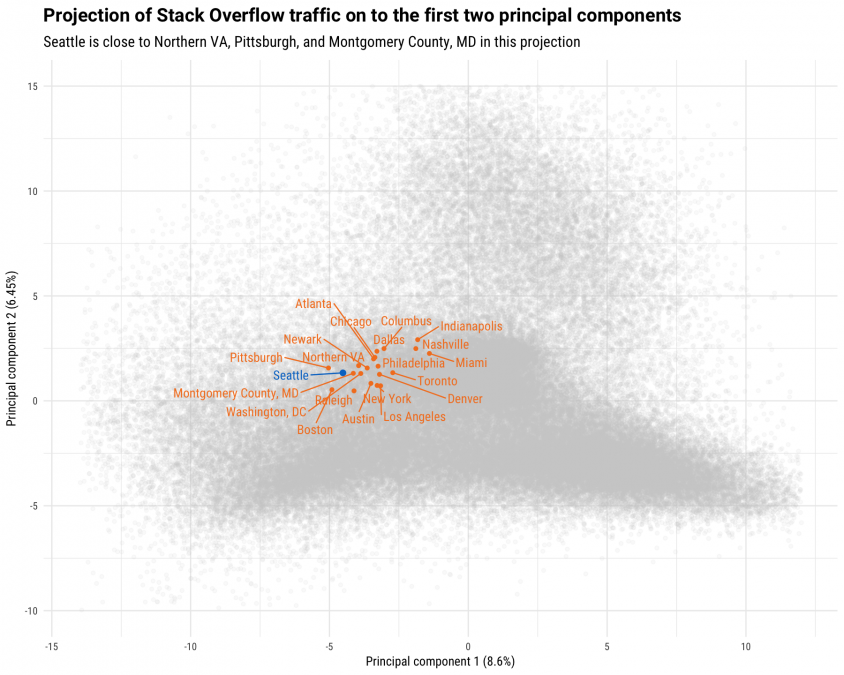
There is a lot of information in a plot like this, so let's talk through some details. The labels on the x-axis and y-axis include what percent variation in the data is explained by each component. Each orange or blue point labeled with a city or region represents the aggregate, average user in that metro area, while the gray points represent real, individual users. The principal component decomposition was calculated using all registered users who visited at least 200 questions in the last year, but these plots show one of out every 10 users, for visual clarity. The analysis in this blog post uses our total, global traffic (not just North America), so the first conclusion we can draw here is that the similarities among Amazon's candidate cities are high compared to global variation in developer traffic. Compared to our traffic worldwide, these 20 locations are pretty similar to each other. All 20 North American cities are focused proportionally more on low-level languages and Python (more to the left), and compared to the worldwide distribution they use more Microsoft technologies (more up). When I ran this analysis but included Redmond and the locations around the Microsoft campus in my definition of what Seattle is, Seattle had a higher contribution from this Microsoft-dominated principal component. Dallas, Columbus, and Indianapolis are furthest in the direction (up) on this plot that indicates more Microsoft technologies; these are cities that have proportionally more developers working with technologies like C#, .NET, and Visual Studio. Depending on how invested Amazon wants to be in the Microsoft tech stack, this might be attractive or a limitation. What if Amazon wants to invest more in mobile development? (I know I have bought plenty of things on Amazon's app on my phone.)

The candidates are even closer together in this plot, and far away from areas (up and left) that are associated with lots of mobile development. We find that mobile development happens a lot in countries outside of North America. If Amazon wants to choose a city with proportionally more mobile developers, good choices would be Los Angeles, New York, and Toronto. What if Amazon wants to invest more in data science and machine learning? All of Amazon's customers experience how they put data science to work, whether it is the recommendation engine or the natural language processing of the Amazon Echo.
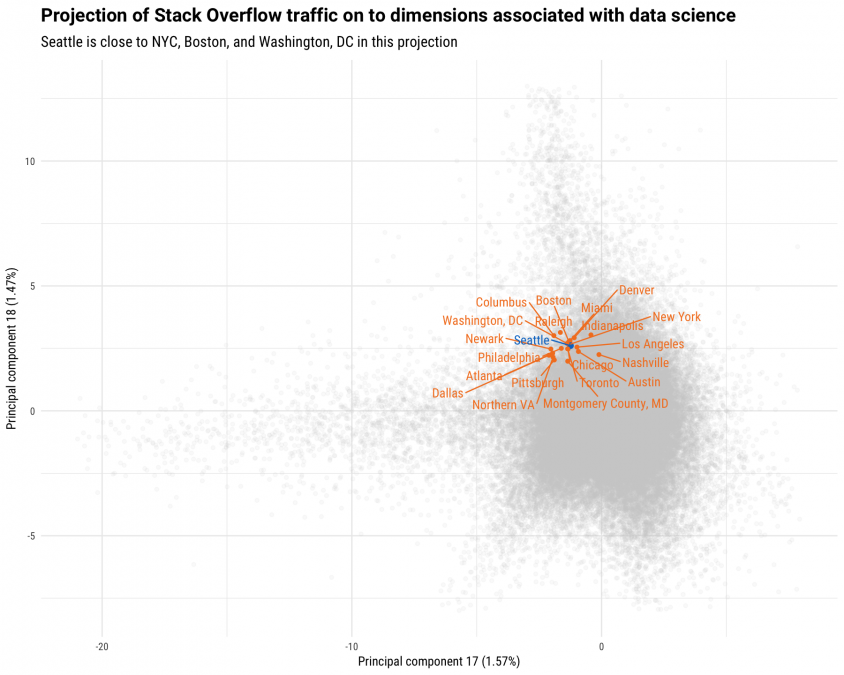
This next plot moves us pretty far down the rank of principal components; notice that these dimensions each account for about 1.5% of variation among our users. All of Amazon's candidate cities have unusually large absolute value and negative-PC17/positive-PC18 values for these two components compared to the global distribution. Let's check out the technologies that contribute to these dimensions in these directions.
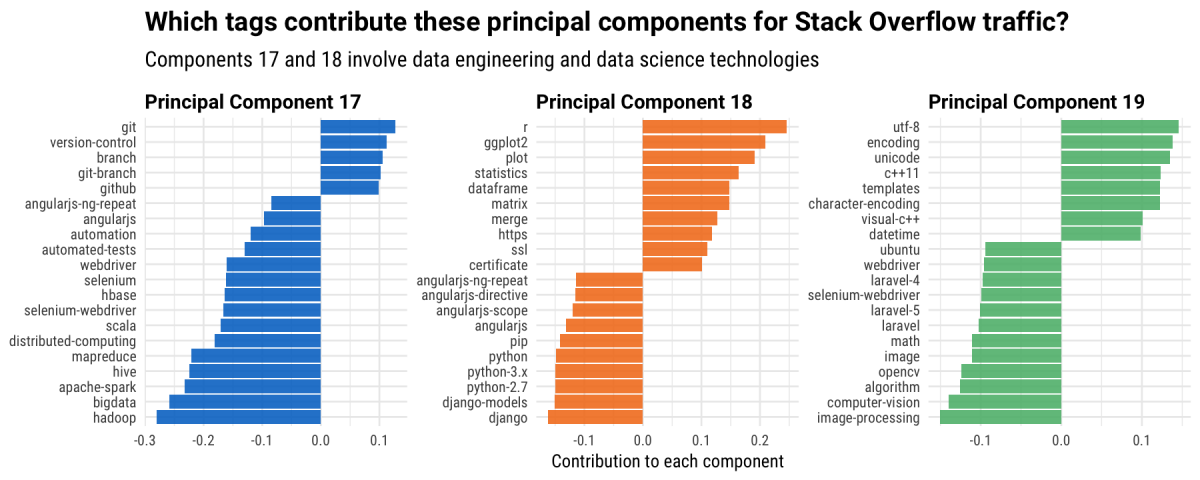
The negative side of principal component 17 involves Hadoop, Spark, Hive, and Scala while the positive side of principal component 18 focuses on R, ggplot2, and statistics. These two components measure how much users are involved in data engineering and data science, respectively, and all of Amazon's candidate cities have relatively large values for these. If Amazon wants to choose a city with proportionally more developers experienced in these technologies, Raleigh and Columbus would be great choices. It is important to note that often we see statistical analysis technologies like R used proportionally more in cities with high academic, research, and grad student populations. Columbus and Raleigh both have healthy academic centers that are likely contributing here, but Amazon specifically listed proximity to major universities as something they are looking for, so maybe this is good!
Where should Amazon establish a second headquarters?
So after all this analysis, what can we say from analysis of Stack Overflow traffic about Amazon's options for a second headquarters? If I were asked to offer insights into this choice, what would I recommend?
- These large cities and metro areas in the United States are quite similar to each other, especially compared to worldwide variation, and it's unlikely that any would be a truly bad choice.
- The choices that are most similar overall to Seattle in terms of technology ecosystems are Northern VA and Washington, DC. If Amazon wants to go with a city where the developer population feels as familiar as possible, these would be the way to go.
- If Amazon wants to choose a city with proportionally more mobile developers, Los Angeles, New York, and Toronto would be the best choices.
- If Amazon wants to choose a city with proportionally more developers working in data science and machine learning, Raleigh or Columbus would be excellent choices.
At Stack Overflow, we're able to explore these kinds of questions because we understand developers, technologies, and how these technologies are related to each other in complex ecosystems. We use this expertise to help companies understand, reach, engage with, and hire developers.