It’s 2023 (we made it!) and after joining Stack Overflow in September 2022, one of my first tasks as a senior research analyst was to pull together statistics for our year-end wrap-up, and to which the natural follow-up question was asked of me, “is this what we expected to see?”
I didn’t know, so I dug into two of Stack Overflow’s exceptional data sources: the annual Developer Survey results and stackoverflow.com’s website data. For research, marrying qualitative and quantitative sources is key in order to validate assumptions and explore the story in the gray area between explicit and implicit behavior.
The 2022 Developer Survey collected responses from Stack Overflow users around the world to find out what programming languages and software development tools are the most popular. And because we’ve been doing this survey for 10+ years, we can see trends in growing (or declining) popularity. We can then use our website data to validate the survey sentiment by looking at what users ask about most.
In this article, we will take a look at what the recent past tells us about what developers will be loving and/or questioning in 2023.
First, I’ll look at what proxies we could use to quantify programming language popularity. Then, I’ll compare this to trends for questions posted about programming languages, using a simple regression analysis in order to elucidate and explain possible relationships between stated popularity and questions asked on Stack Overflow.
Most popular and according to whom
No source of information is better at tapping into developer sentiment than our own Developer Survey. What languages did the developer community tell us they loved in 2022?
In the survey results for Most Loved, we categorize everything so it’s easier to compare like-to-like (i.e. languages vs. frameworks vs. libraries, etc.). I’m going to take a cue from the survey and focus on programming languages for this question; drawing comparisons within types makes sense and avoids introducing another layer of complexity.
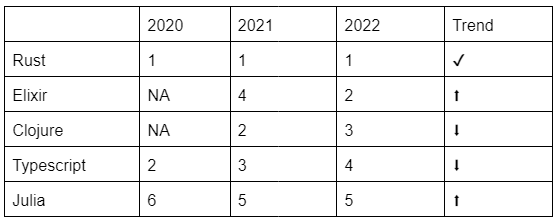
Rust, Elixir, Clojure, Typescript,and Julia are at the top of the list of Most Loved Programming Languages. However, in looking at the last three years, we see a bit of movement.
Most Loved Rank in Developer Survey
In 2022, we added a drill-down to specifically show popularity amongst those learning to code. Because Stack Overflow is a learning resource, I would expect that popularity amongst those specifically learning would be a good indicator of current and future programming language popularity.
There is an interesting pattern in comparing Most Loved and Learning to Code Popularity: people learning to code aren’t using the most loved languages. The difference between these two measures of popularity will be important in distinguishing both as possible explanatory variables for trends in question posts. Less than 1% of those learning responded they were using either Clojure or Elixir:
- 1.2% are using Julia
- 7.1% are using Rust
- and 15.1% are using Typescript.
How else might we set up expectations for trends amongst the many programming languages being asked about on Stack Overflow? I found two good sources that are worthy proxies for popularity: Google and GitHub.
For web searches, I’m using the already established PYPL index, which is an aggregated source for Google Trends data specifically for programming language tutorial search history. From this dataset, we will focus on annual trends in programming languages share of search.
GitHub publishes statistics on public repositories for anyone to use as a handy public dataset within Google BigQuery, and although we lose the information from private repositories, we can assume the public accounts speak more directly to popularity as they are tied to learning initiatives, portfolios, and open-source collaboration, which are mostly self-directed rather than mandated by existing business rules. From this dataset, we will focus on the annual trend in public repo pull requests by language.
Looking at the basic relationship between Most Loved percent and annual rank in questions asked, we see a slight relationship over the years, but not a strong one. The simple regression here shows 2022 has the strongest correlation in the last three years and that only 7% of the variation in ranking for 2022 questions asked can be explained by 2022 Dev Survey results for most loved programming languages.
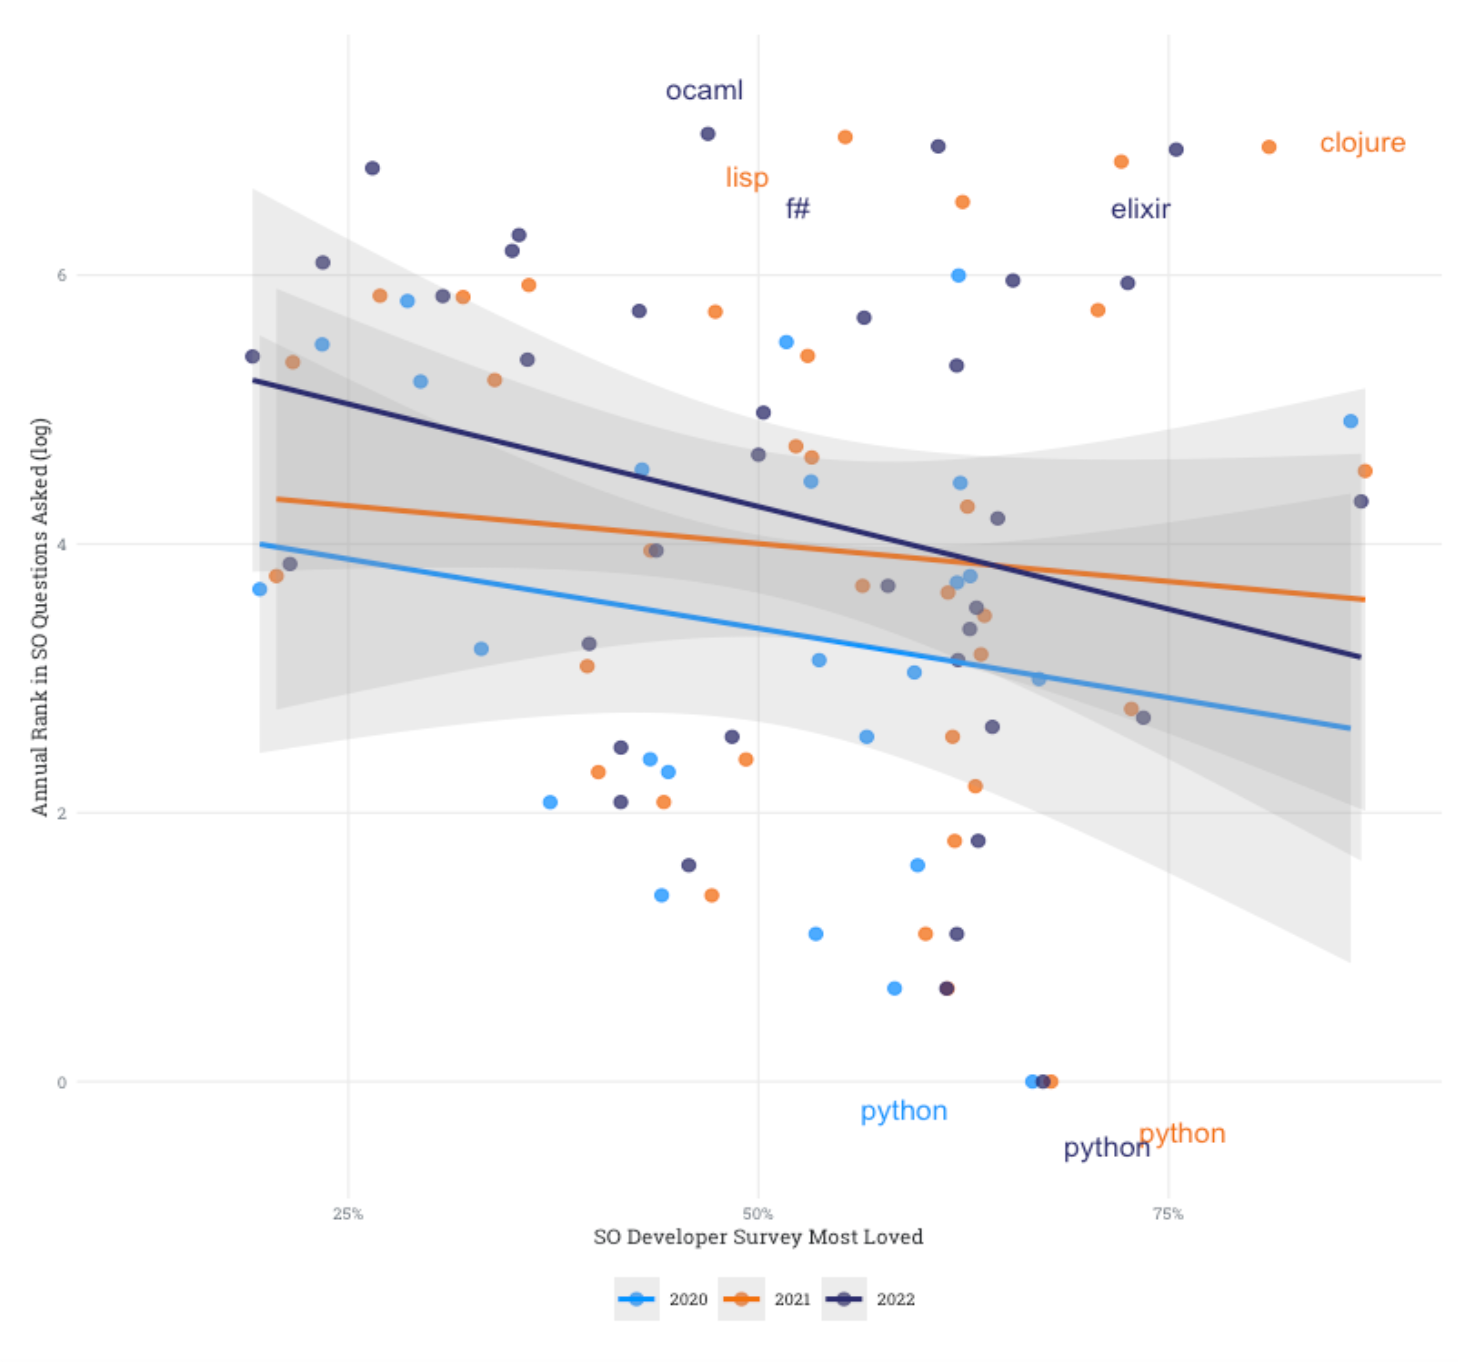
This graph shows that being loved (via the Developer Survey) is not related to generating more questions on Stack Overflow. And this makes sense: posting questions most likely speaks to friction with coding, a friction that may lead to loving a programming language less.
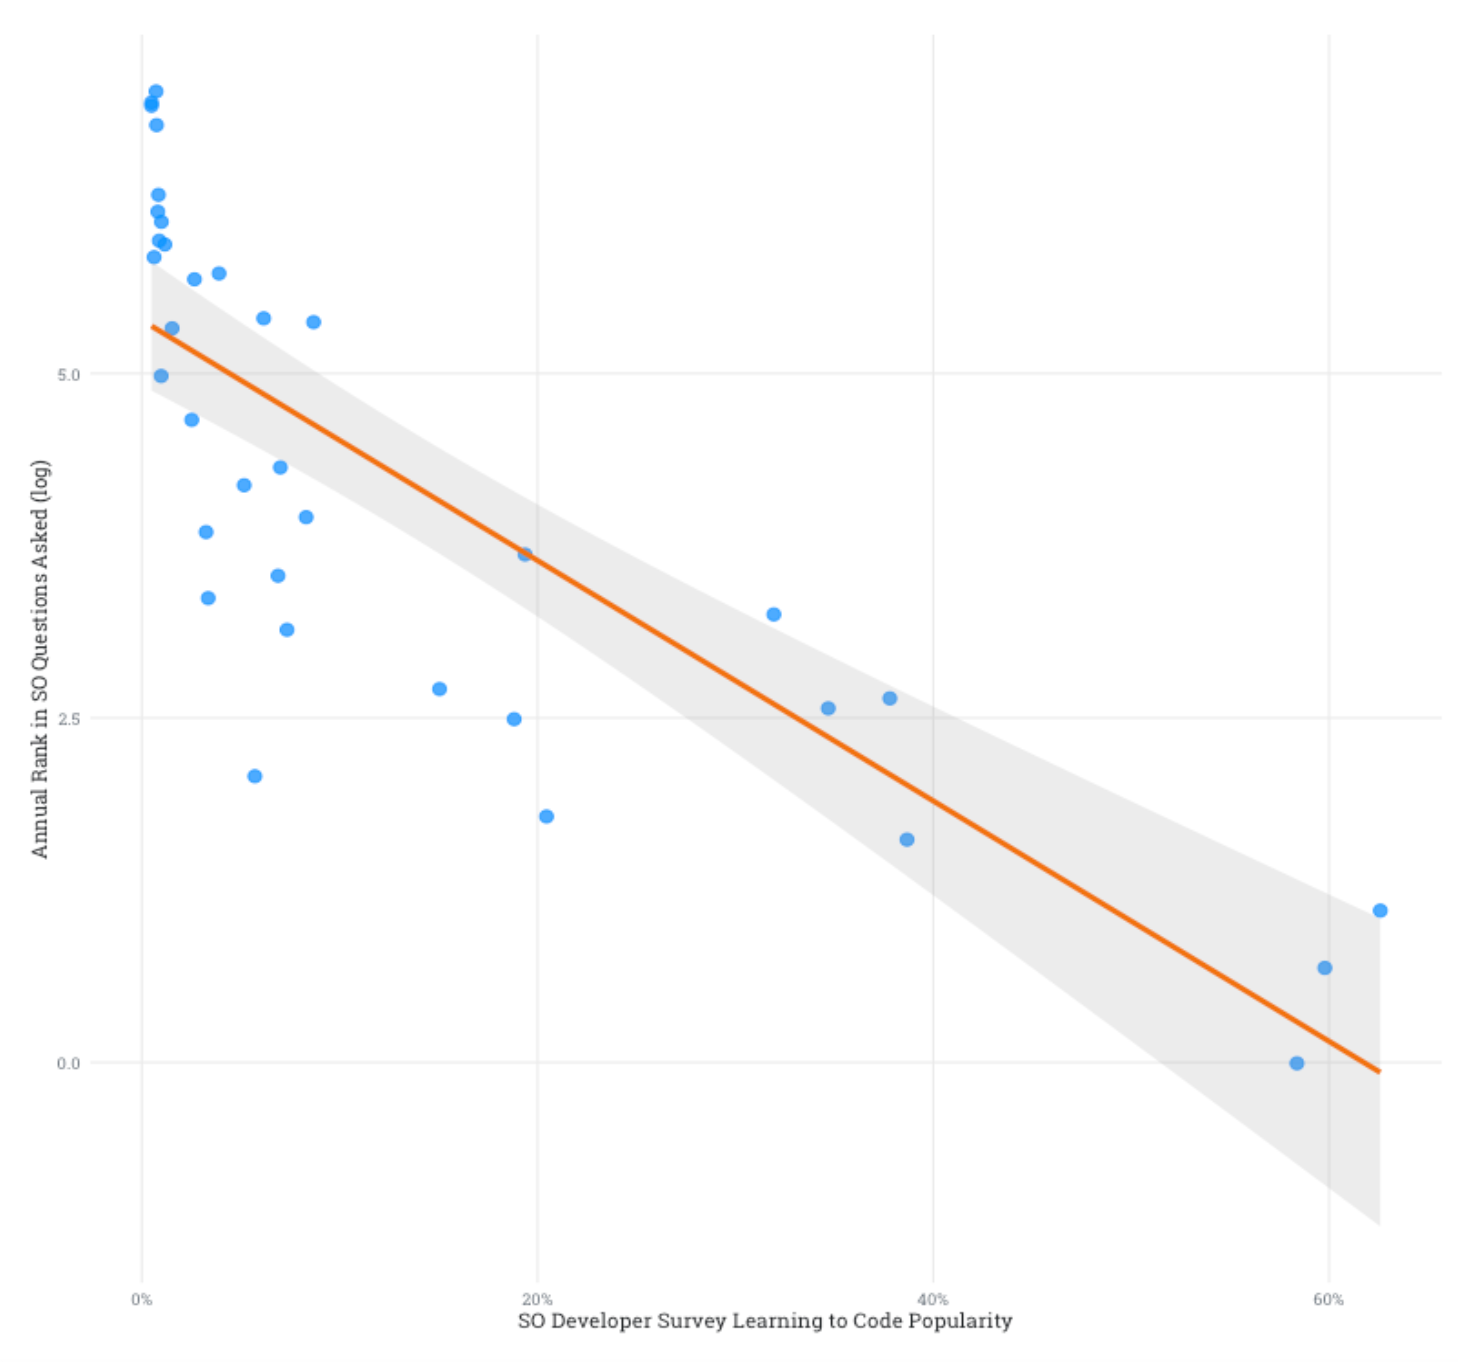
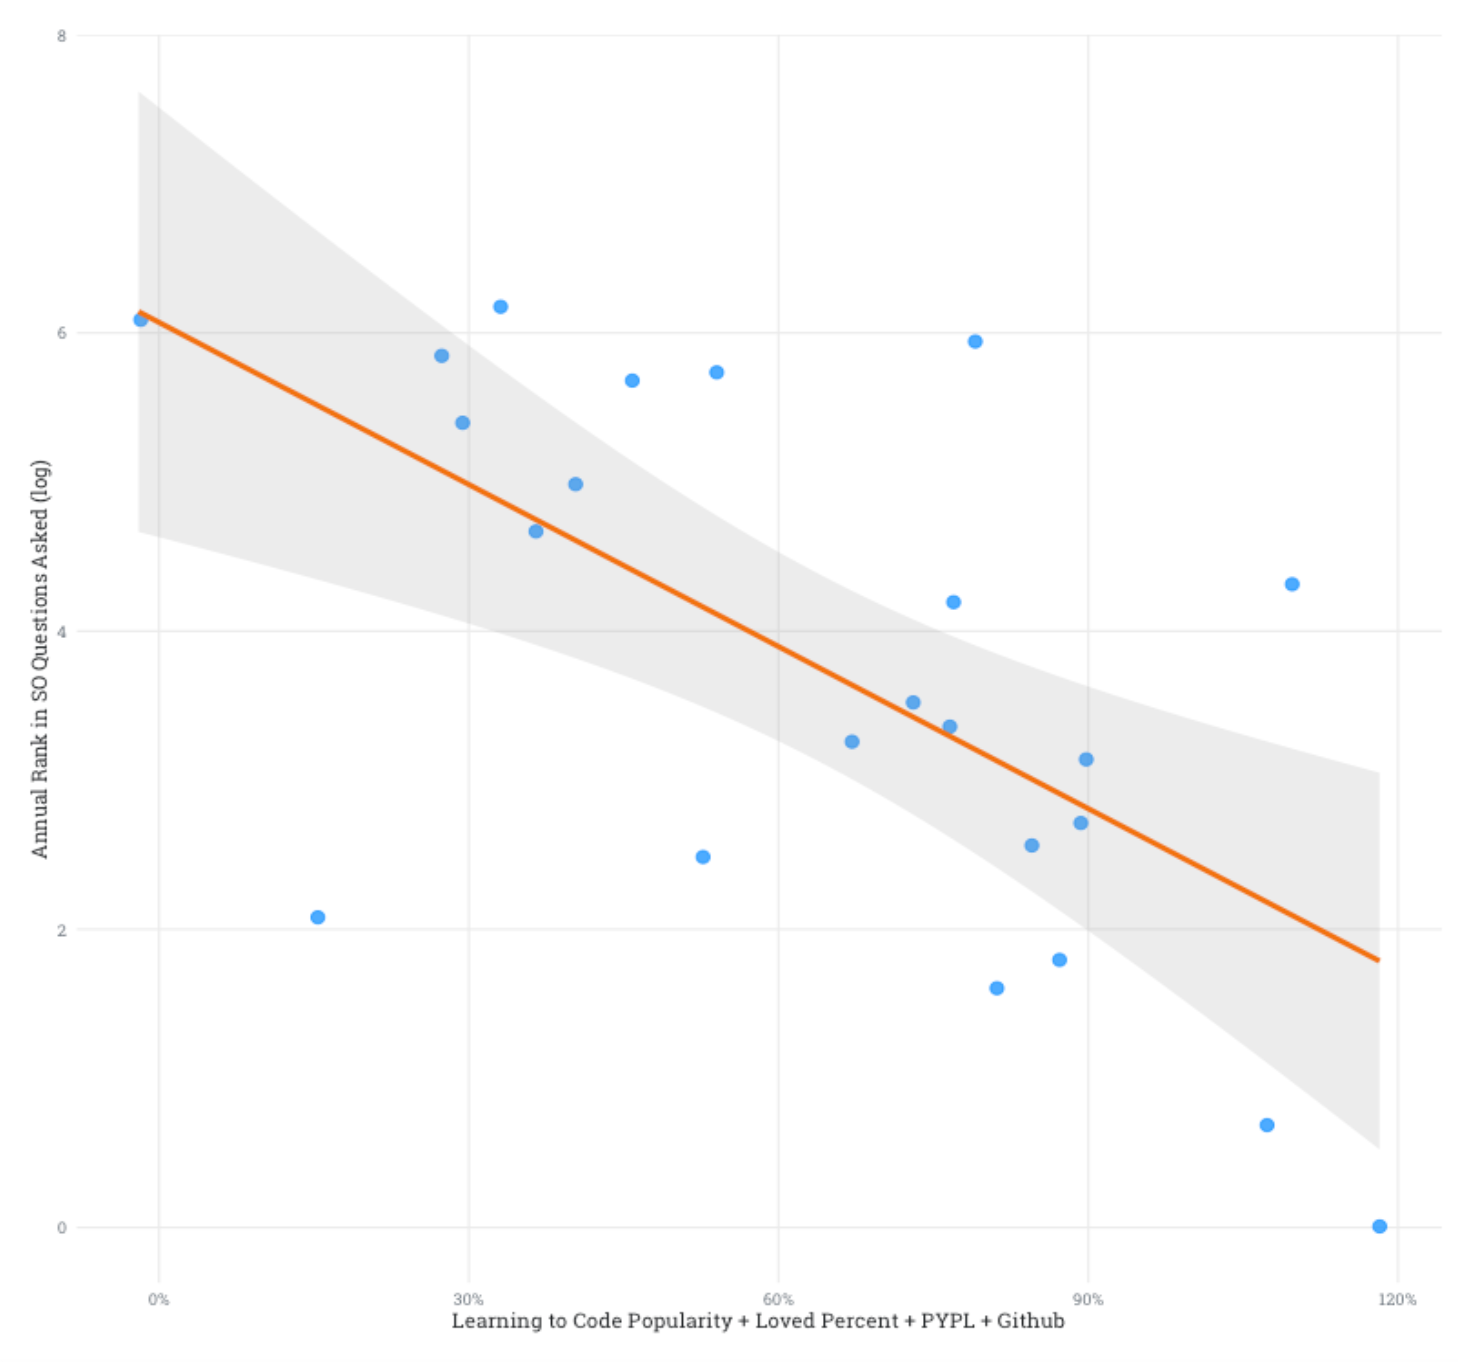
When we add in our additional proxy variables for language popularity, usage percentage among those learning to code in the 2022 Developer Survey, the trend in PYPL from 2021 to 2022, and the trend in Github pull requests from 2021 to 2022, we get better regression results. Using just Learning to Code Popularity gets us a better regression that explains 67% of the variation in ranking for 2022 questions. A logical conclusion here is that Stack Overflow questions are more susceptible to the preferences of those using the site as a learning tool rather than those of more advanced developers.
Adding in the other popularity proxies and loved percentage gains us additional regression power (75% variation explained!) and we have landed on our final answer: trends in the number of questions posted about a programming language on Stack Overflow can be explained by what more developers learning to code are using (most significantly of all factors) along with Google search trends, GitHub public pull requests, and the Developer Survey Most Loved percentage (less significantly of all factors). Our latest Developer Survey showed us that ~32% of programmers have been professionally coding for four years or less, a significant amount of people who are most likely involved in learning programming languages. That is, beginner-friendly languages get the most questions and popularity, but the Most Loved languages make veteran developers happy.
A peek into the last three years
Let’s look at the top tags from questions asked in 2022 and how they line up with what we would expect from the regression model above.
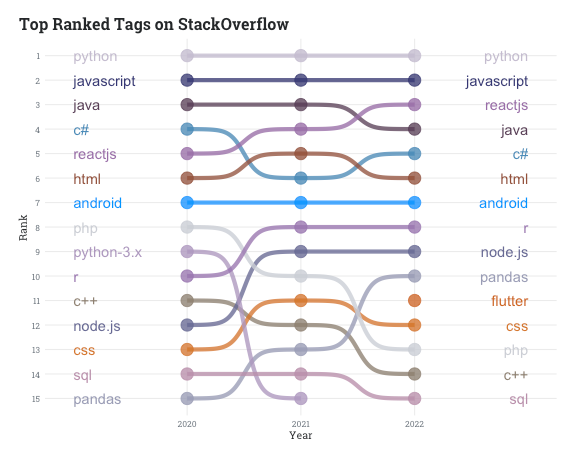
We counted the number of questions associated with each unique tag; each can have up to five tags, so questions will get counted more than once. Python and JavaScript are solidly positioned in their respective top spots, Reactjs and Java show competing question counts starting towards the end of 2021, and ultimately Reactjs takes the lead with consistently more questions tagged in 2022. HTML and C# switch spots monthly in 2021, though C# moves ahead in 2022 with consistently more questions. In the lower ranks, Pandas sees three years of growth, R increases rank in 2021 and holds, nodejs breaks into the top 10 in 2021 and holds, while both PHP and C++ decline.
Compared to our learning to code popularity metric, Python, JavaScript, and Java are inline with expectations being at the top of both lists. According to the same metric, we would expect more questions about SQL and PHP. This shows that there is more to the trend than just measurable popularity. The factors that lead up to searching for tutorial on Google or GitHub pull requests from public repositories, for example, could be influenced by content creation in the academic and online learning spaces, which in turn could be influenced by nuances in tech evolution (e.g. Python-3.x as a short-lived top-ranked tag before it became the standard version). The next Developer Survey will be the canary in the coalmine illuminating any changes in expectations for the types of questions being asked on Stack Overflow.