
We are on the precipice of brand new results from the 2026 Developer Survey. We have 15 years of data and insights from this survey at our fingertips that shows more than just what one year’s collection of insights will explore. A year-over-year look at the Developer Survey offers the long view of what is changing in the broader technology ecosystem. This analysis compares the 2024 and 2025 Developer Survey data across three connected stories: the evolution of AI, humans at work, and demographics and community. The survey results reveal what the headline news cannot: how people actually fold these tools into daily work, where they still want human judgment, and how changing workflows affect the communities developers rely on.
The AI evolution from copilots to autonomous systems
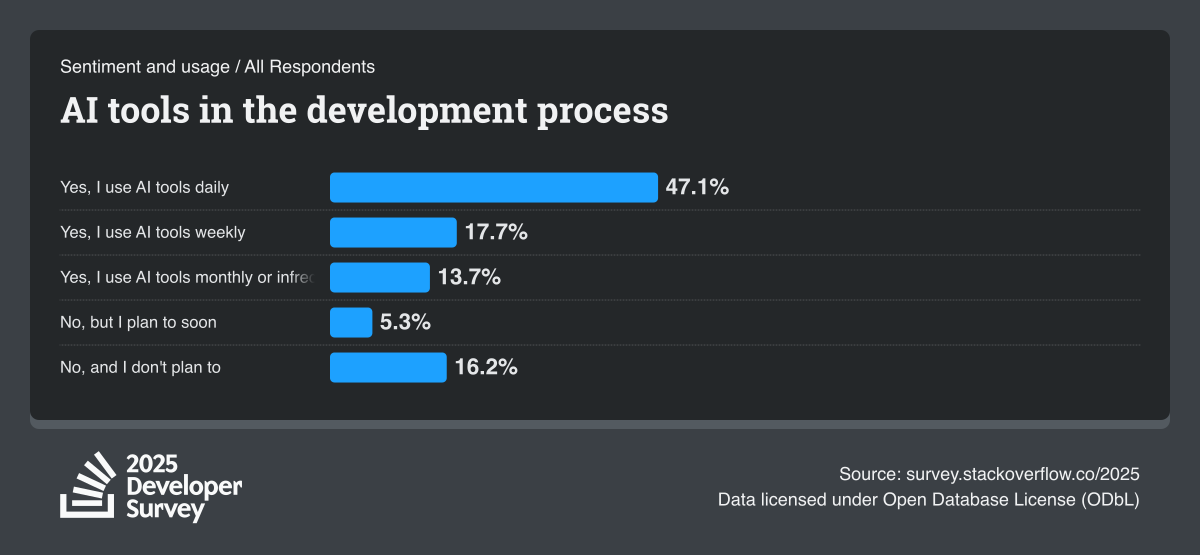
AI tool usage has grown in our survey since we initially started asking about AI tools in the development workflow in 2023. 44% of developers indicated they were using AI tools in 2023, growing to 62% in 2024 and 79% in 2025, with almost half of all respondents indicating they used AI tools daily. What can the survey show us about this growth in AI usage that we don’t already know from news stories about frontier lab spending, AI stocks and earnings reports increasingly citing organizational restructuring enhanced with AI efficiencies?
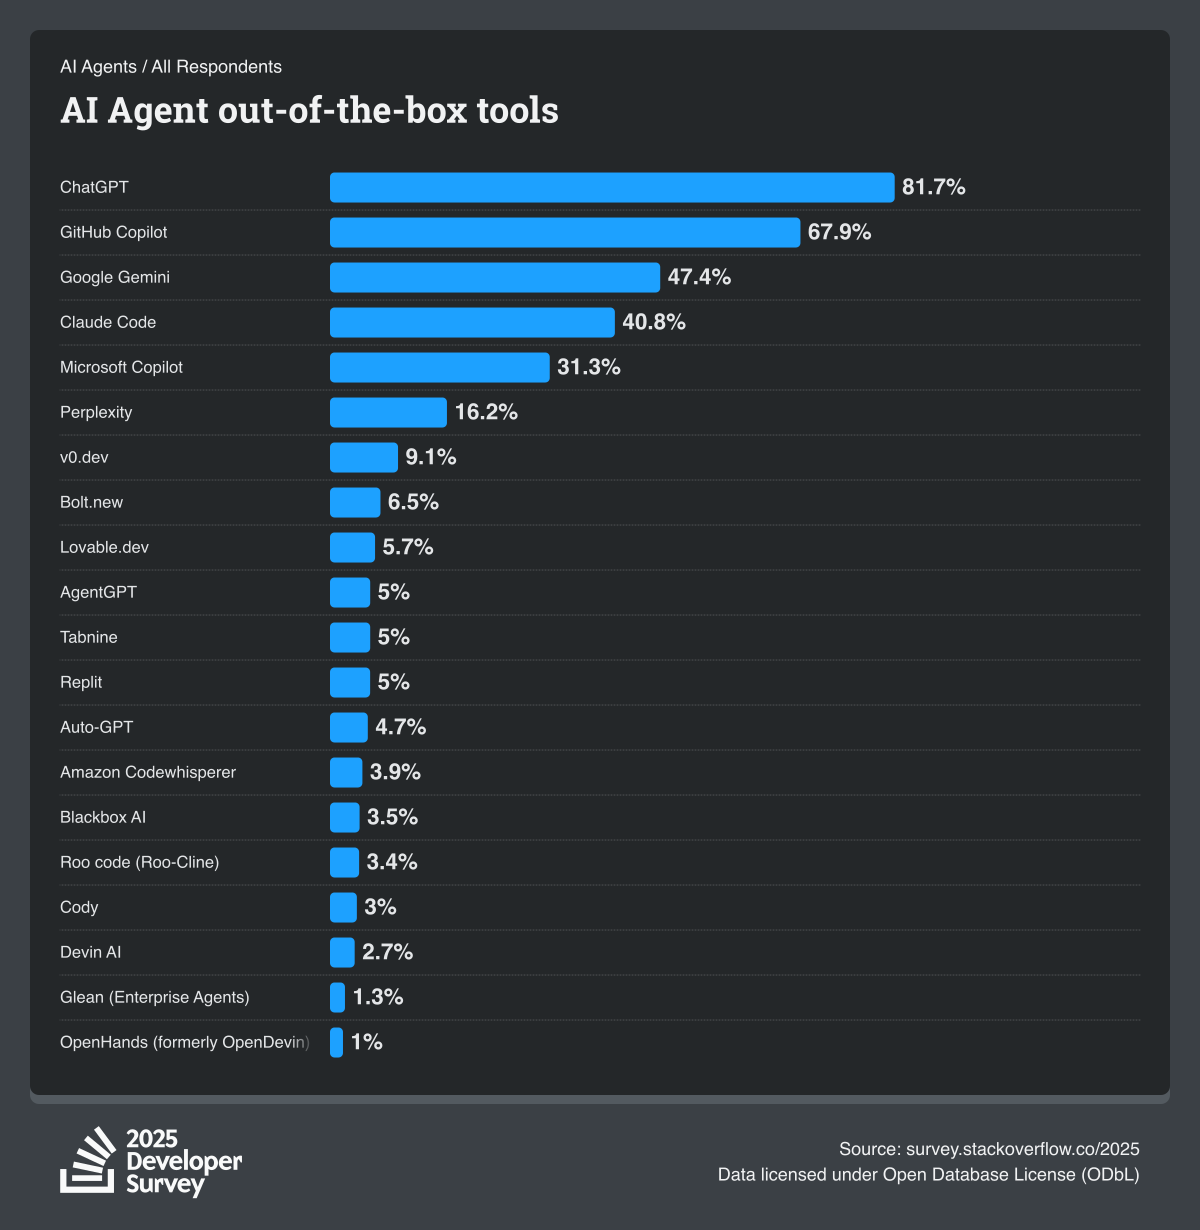
We started asking about AI agents in the 2025 Developer Survey, with 31% of respondents indicating they were using them and most using ChatGPT (82%) and GitHub Copilot (68%). We held a smaller pulse survey in April 2026 asking about agents again, and this time we see agent use as almost doubled (59%) and Claude Code increasing in usage (from 41% to 55%). Something else the pulse survey on AI agents pointed out was that usage was driven by those that were daily users and those that were in more executive roles.
AI tools and their uses
When developers step into the world of AI tooling, ChatGPT and GitHub Copilot serve as the primary gateways. In our 2025 survey, 82% of those utilizing out-of-the-box assistants selected ChatGPT, while 68% turned to GitHub Copilot. Google Gemini trailed at 47%, followed by Claude Code at 41% and Microsoft Copilot at 31%. Farther down the long tail, niche offerings saw smaller footprints: Perplexity reached 16%, v0.dev hit 9%, Bolt.new gathered 7%, and Lovable.dev captured 6%. This breakdown suggests developers gravitate toward established platforms prior to experimenting with tailored autonomous setups.
Year-over-year trends reinforce this dynamic, even though survey design evolved. Back in 2024, when respondents marked single active usage options, 82% applied AI toward writing code, 68% relied on it for research, 57% tapped it for debugging, 40% drafted documentation, and 35% created general content. Because 2025 split these tasks between primary and secondary reliance, direct line-item comparisons are tricky. Nevertheless, the underlying trajectory stays clear: discovery and drafting lead the pack in automation, while actual software engineering remains predominantly assisted rather than autonomous.
Learning to use AI
Individuals who are learning to program are adopting automated tooling at an accelerated pace even as caution creeps in. In 2024, 63.0% of student respondents reported utilizing AI resources; by 2025, that metric climbed to 73.3%. This includes 39.5% engaging with these platforms daily, 18.7% weekly, and 15.1% monthly. This technology shift is part of everyone’s educational journey, with newcomers jumping in just as frequently as experienced professionals.
However, overall enthusiasm has noticeably tempered. Positive sentiment among learners dropped from 72.2% in 2024 (comprising 22.4% very favorable and 49.8% favorable) down to 52.8% in 2025 (19.3% very favorable, 33.5% favorable). Meanwhile, skepticism quadrupled, rising from 6.4% up to 26.3%. The overall survey population showed a similar cooling trend, moving from 72.0% positive and 6.4% negative in 2024 to 59.7% positive and 20.4% negative in 2025. Initial novelty is giving way to pragmatic evaluation as students confront inaccurate, incomplete, or confusing outputs.
Confidence in output accuracy similarly waned among students, with moderate or high trust sliding from 49.1% in 2024 (44.9% somewhat, 4.2% high) to 37.4% in 2025 (31.3% somewhat, 6.1% high). While 2025 introduced a neutral option that redistributed responses, the broader shift highlights a more discerning audience. Sentiments around handling intricate assignments echo this sentiment: favorable ratings for complex work fell from 41.5% in 2024 to 33.7% in 2025, while 18.6% admitted they avoid using AI for advanced tasks or remain unsure of its reliability.
Autonomous agents haven't quite won over the learning cohort, either. In 2025, 28.4% of students utilized agents, whereas 44.1% expressed no intention to implement them, compared to 37.9% across all survey takers. Concern over AI replacing jobs stayed flat at 15.0% across both years, though uncertainty dropped from 27.1% to 21.3% as unconcerned responses grew from 57.9% to 63.6%. Usage might be accelerating, but healthy skepticism remains, underscoring that using tools for study doesn't mean blindly embracing every feature on the horizon.
Work is about more than just a paycheck
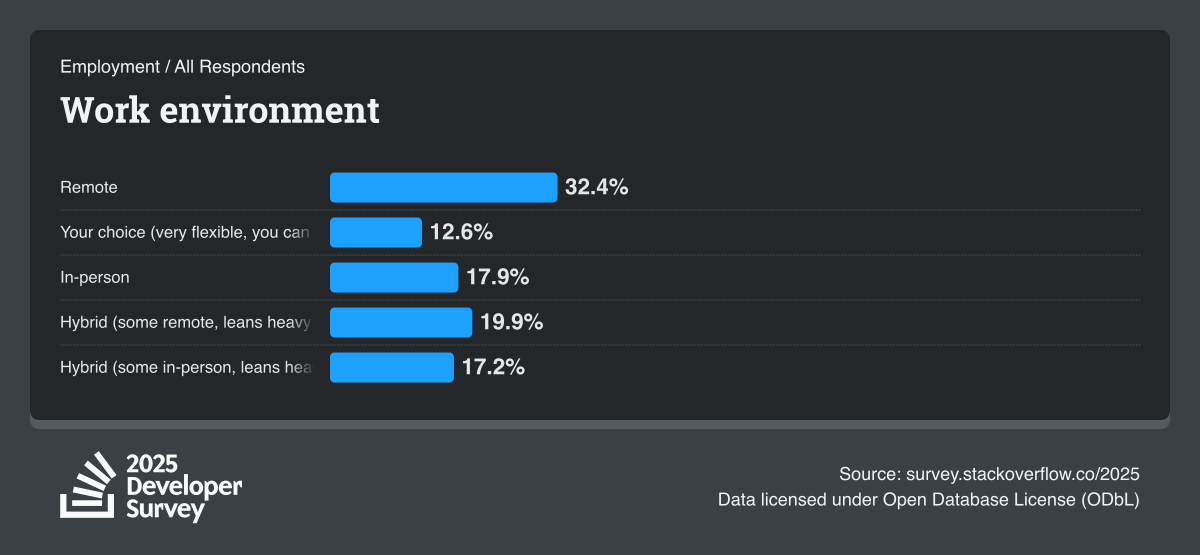
Work-life balance continues to be an evolving story with the shifting office landscape. We have been tracking work setting in the Developer Survey since 2019 when only 12% of survey respondents indicated they worked fully remote. Since then, we saw a peak in remote work being reported in 2022 with 43% being fully remote. Hybrid work settings became the new majority for respondents in 2023 and 2024 at 42%. Last year we started capturing whether the hybrid situation was left up to choice, 13% indicated that their work situation was flexible enough for them to choose when to come into the office. We continue to ask about work setting this year and are curious about the implications it has with job satisfaction.
Job satisfaction is hard to pin on any distinct features because it is highly individualized. For early-career employees, work setting could be indicative of job satisfaction because they value learning from their peers and mentorship and hybrid or in-office is better suited for that. For people managers, work setting could be completely low stakes compared to what salary can provide in terms of job satisfaction. Some people may live in areas that make the experience of commuting to work enjoyable.
The 2025 survey data highlights how working environments have evolved past a basic split between remote and office settings into a much more nuanced picture. Across respondents, 32.4% reported working completely remotely, 17.9% stayed strictly on-site, and 37.1% navigated one of two structured hybrid models. Meanwhile, 12.6% noted high flexibility, coming in only when personal preference or project needs dictated. In comparison, 2024 figures stood at 38.0% remote, 42.0% hybrid, and 20.0% in person. Fully remote setups dipped roughly six percentage points year-over-year while strictly in-person arrangements edged down two points. Taking these updated granular options into account, total respondents enjoying some degree of remote work flexibility reached 82% in 2025, slightly above the 80% combined total recorded in 2024.
Geographic breakdowns give vital context to these top-level numbers. The United States led in fully remote participation at 45.0%, whereas India claimed the highest share of on-site professionals at 30.5%. European nations like Germany and the United Kingdom leaned heavily into flexible hybrid balances: Germany logged 20.7% in the flexible self-selected category alongside 24.6% in the flexible-leaning hybrid, while the UK registered 14.0% and 25.8%, respectively. France showed the strongest preference for office-leaning hybrid arrangements at 32.8%, well above the US metric of 16.7%. Tracking self-directed choice reveals key nuances that binary remote-versus-office surveys obscure: German tech workers maintained exceptional overall flexibility despite only 22.5% operating as fully remote.
Tools at work
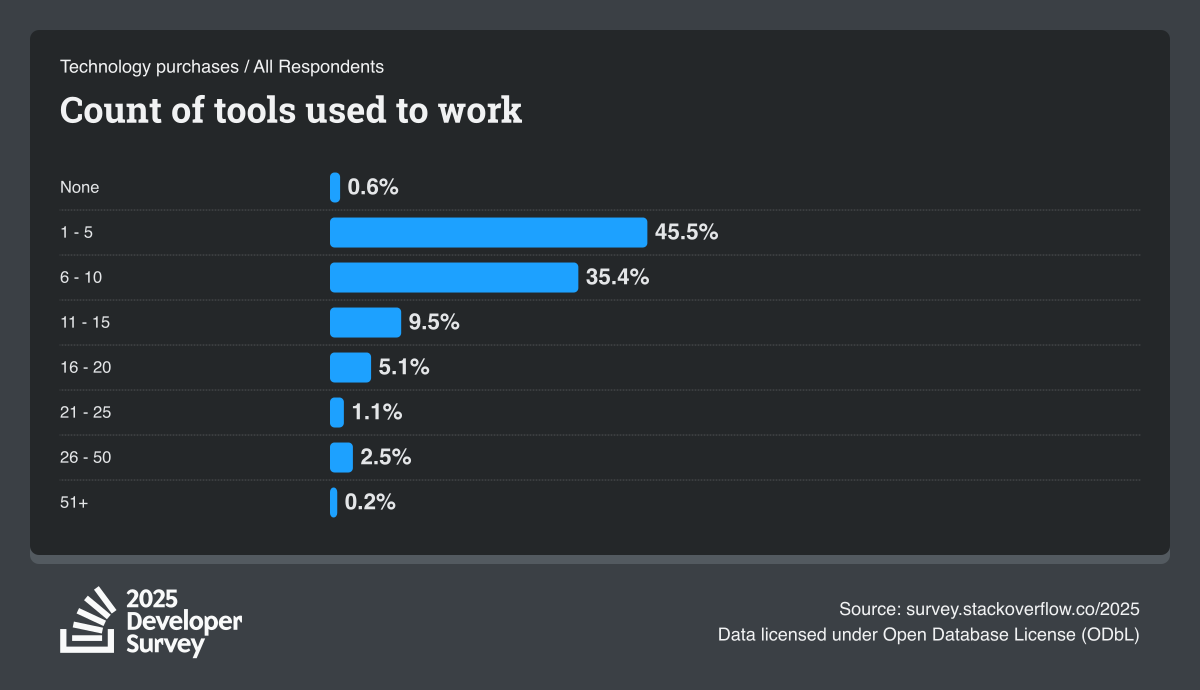
Most engineers handle a structured yet manageable daily toolkit. Among the 27k+ individuals responding to 2025’s survey, 45.5% rely on 1–5 platforms while 35.4% utilize 6–10, showing that roughly 81% keep their ecosystem under ten primary solutions. An additional 9.5% work with 11–15 platforms, 5.1% use 16–20, and a final 3.8% operate across 21 or more systems. While widespread tool proliferation is rare, nearly one out of every five developers navigates over 10 systems to still cope with significant context-switching friction and maintenance overhead.
Foundational enterprise systems continue their steady expansion. Docker jumped from 35.0% in 2020 to 71.1% in 2025, Kubernetes scaled from 8.5% in 2019 up to 28.5% in 2025, Terraform moved from 6.2% in 2020 to 17.8% in 2025, and PostgreSQL surged from 32.9% in 2018 to 55.6% in 2025. Conversely, internal communication habits show shifting preferences: Microsoft Teams grew from 25.6% in 2020 to 53.1% in 2024, whereas Zoom dropped from 56.1% in 2022 down to 40.0% in 2024, and Slack adjusted from 53.0% in 2020 to 43.9% in 2024. Trello usage contracted from 29.6% down to 13.7%, while Jira remained remarkably consistent at 46.4% in 2025 compared to 47.7% in 2020; Confluence similarly held steady at 32.8% against 32.4%.
Next-generation, AI-focused developer tooling made its initial splash in enterprise environments during 2025. Cursor captured 17.9%, Claude Code reached 9.7%, Windsurf registered 4.9%, and Aider hit 1.9%; meanwhile, established mainstays like GitLab recorded 35.6% and Google Colab posted 7.0%. These early footprints don't reflect a fully-matured landscape just yet. Instead, they demonstrate that emerging AI offerings are quietly integrating alongside—rather than immediately displacing—the fundamental stack and collaboration layer powering modern tech organizations.
Job satisfaction in different countries
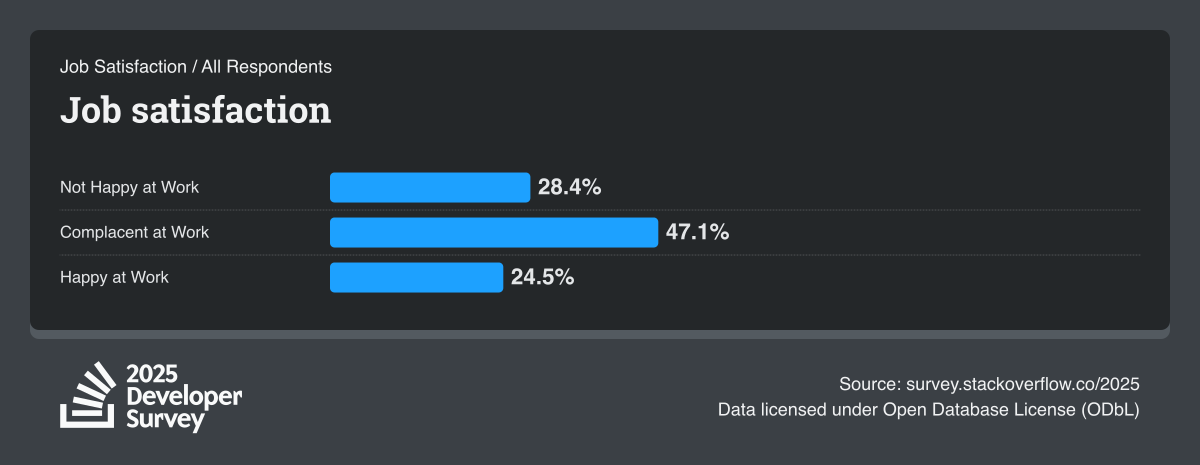
Overall job satisfaction presents a much more complex story than simple survey metrics might convey. For 2025, 28.4% of respondents reported feeling unhappy, 47.1% indicated feeling complacent, and 24.5% felt genuinely happy at work. The overwhelming majority resides in the middle ground, with nearly half of all developers feeling neither fully engaged nor actively disaffected. This signals that addressing career fulfillment is an ongoing opportunity for organizations, rather than a clear-cut binary of content versus discontented employees.
Regional variations highlight deeper trends. Tech workers in the US reported the highest happiness levels at 28.7%, with 27.0% unhappy and 44.4% feeling complacent. German respondents noted the lowest happiness rates at 19.2% alongside the highest share of complacency at 50.7%, whereas India saw the highest proportion of unhappy sentiment at 32.7%. UK figures landed at 31.5% unhappy, 46.4% complacent, and 22.1% happy; France recorded 27.4%, 48.0%, and 24.6%, respectively. While office policy alone doesn't dictate overall happiness, these figures demonstrate why global workplace strategies require local sensitivity.
Emerging AI shifts contribute to this changing dynamic. Developers identifying AI as a threat to their job increased from 12.1% in 2024 to 15.0% in 2025, while unconcerned responses dropped from 68.3% down to 63.6%, and uncertain sentiment ticked up from 19.6% to 21.3%. Concurrently, 2025 satisfaction factors place autonomy and trust to manage your own tasks at the very top, followed by competitive pay and benefits, solving real-world problems, and innovation through solving challenging and complex problems. Developers deeply prioritize independence and impactful projects precisely as automated systems introduce new questions around ownership.
Compensation shifts saw wide-ranging yet varied gains. Median annual compensation jumped 29.3% for product managers, 28.9% for applied scientists, 28.7% for game and graphics developers, 27.1% for mobile developers, and 24.0% for front-end engineers between 2024 and 2025. Conversely, growth was far more modest for data engineers at 5.1%, cloud infrastructure roles at 6.7%, and system administrators at 8.4%. Finally, the overall industry structure remains strongly grounded in hands-on technical roles: 85.3% identified as individual contributors compared to 14.7% in people management, reinforcing why professional autonomy and clear technical career ladders remain paramount to job satisfaction.
There’s learning to code, then there is learning to code for AI
AI is becoming part of how people learn to program, but growing use does not necessarily mean growing enthusiasm. Among Developer Survey respondents learning to code, 63.0% reported using AI tools in their development process in 2024, increasing to 73.3% in 2025. Over the same period, favorable sentiment toward those tools fell from 72.1% to 52.8%. These annual snapshots capture different respondents, but the contrast raises a useful question: how well does AI support understanding alongside getting something done?
The 2025 findings offer some context for that distinction. Among respondents answering the question about AI frustrations—not just those learning to code—20.0% reported becoming less confident in their own problem-solving, and 16.3% said it was hard to understand how or why the code worked. These responses do not establish that AI weakens learning, but they identify a difficulty worth investigating: producing working code and being able to explain it are now different processes.
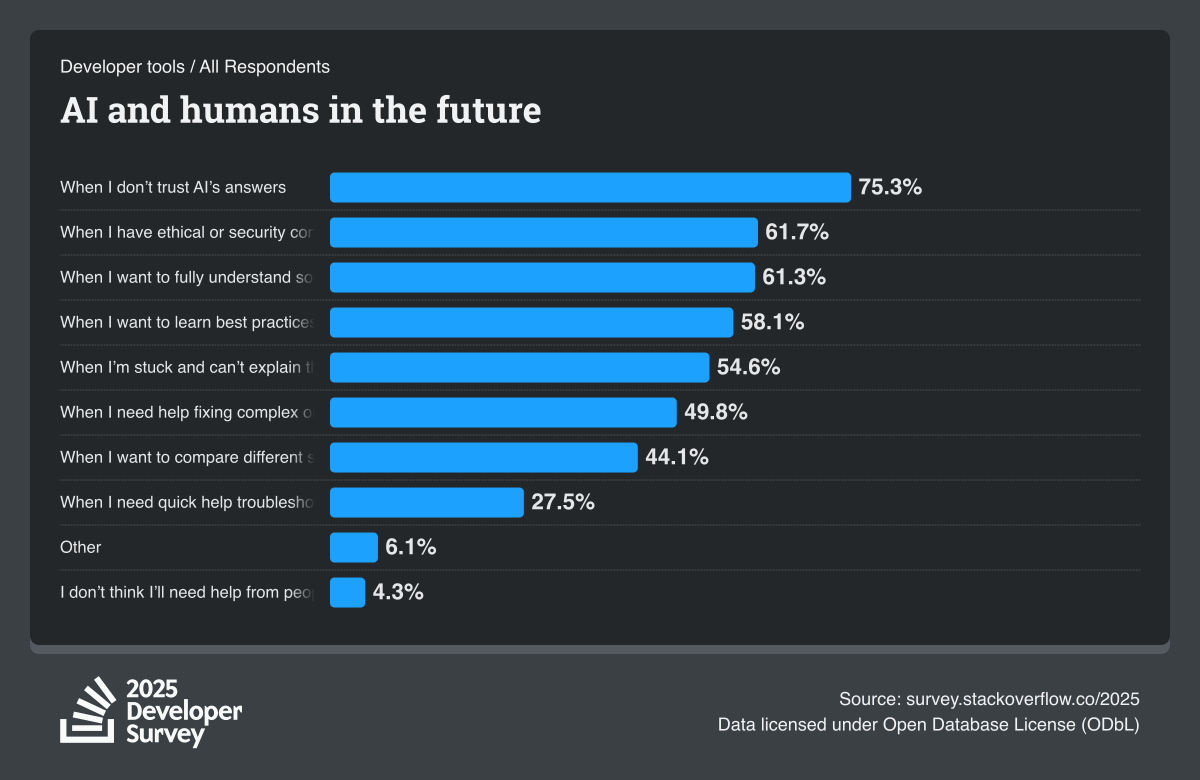
Developers’ interest in learning from others provides another piece of the picture. In 2024, 41.0% of respondents answering how they used Stack Overflow selected learning technologies or techniques that were new to them, while 68.7% selected finding reliable guidance from community-vetted answers. In 2025, when asked to imagine a future where AI could perform most coding tasks, 61.3% of respondents said they would still seek another person’s help when they wanted to fully understand something, and 58.1% when they wanted to learn best practices.
Those questions measure different things—reported platform use and hypothetical preferences—but together they suggest a useful direction for future research. Beyond asking whether people use AI while learning to code, we need to understand what they learn from it: can they explain the result, evaluate alternatives, and apply that knowledge to the next unfamiliar problem? The retrospective establishes that AI use has become more common among learners. Whether that use translates into greater understanding remains an open question.
What to expect next
The broader trajectory does not suggest developers have blindly embraced or dismissed automated tools. Usage metrics keep expanding—climbing from 62% AI tool participation in 2024 up to 79% in 2025, with agent adoption surging from 31% in 2025 to 59% in the April 2026 pulse—yet enthusiasm is noticeably cooling. Favorable sentiment among students dropped from 72.2% down to 52.8%, while career anxiety rose from 12.1% to 15.0%. The next phase will be defined by how well tools, workplaces, and communities respond to that mixed reality: more AI in the workflow, more scrutiny of its limitations, and a continuing need for trustworthy human context.
The 2026 Developer Survey results can help us investigate some key questions:
- Does the gap between AI use and favorable sentiment persist? Compare consistent measures and respondent groups, including people learning to code.
- Does agent adoption come with greater delegation? Track frequency of use separately from the tasks and decisions people allow agents to handle.
- How does control over work relate to satisfaction? Distinguish attendance arrangements from autonomy, and examine comparable groups before interpreting differences.
- How does AI fit into community use? Separate visits for AI-related problems, demand for reliable guidance, participation, and belonging.
Be on the lookout for the results dropping here in the next days.