
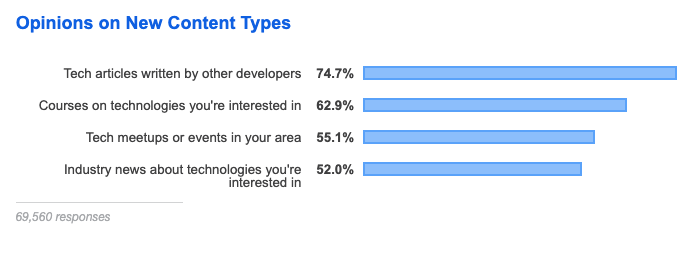
In our 2019 Dev Survey, we asked what kind of content Stack Overflow users would like to see beyond questions and answers. The most popular response was "tech articles written by other developers."
So starting this week, we will begin highlighting articles written by your peers. If you have an idea and would like to submit a pitch, you can email pitches@stackoverflow.com. Our first piece comes from Alessio Civitillo, an Analytics Manager at TE Connectivity in Munich.
What To Make of Two Major Acquistions
Recently we saw two major deals take place in the business intelligence space: Google paid $2.6 billion to acquire Looker and Salesforce ponied up a whopping $15.7 billion for Tableau. Both of the recently purchased companies focused on offering cloud based BI tools, a space I am quite familiar with, having spent one year rebooting a major Salesforce project for 500 users and the last two-and-half years as an analytics manager at TE Connectivity serving about 600 internal users.
So why did Salesforce and Google make these big acquisitions? The most obvious answer is that working with data is increasingly happening across multiple departments, and many employees who are not well versed in programming or statistics are turning to these dashboards to help them understand data and share those insights. From sales, to revenue operations, to customer support, teams are recognizing the value of collecting and analyzing internal data.
So what comes next? Will these tools be easy to integrate and actually make the product suites offered by Salesforce and Google Cloud more attractive to folks like me? Personally, I see them as defensive moves, a strategy to protect incumbent product portfolios by snapping up fast growing competitors. If they can tightly integrate these acquisitions, that may help to consolidate usage among existing clients who previously worked with tools from multiple companies.
As I look at these acquisitions, however, I think it's worth noting another interesting trend. While dashboards are great, I think that the flexibility of simpler, open-source tools is beginning to win out among developers like myself. For those willing to spend a little time learning how to program with these tools, they can provide a powerful alternative worth exploring.
Data, data, everywhere
Tableau has also captured the attention of marketing and sales departments in many companies worldwide. Many companies are using Salesforce already and will benefit from a tighter integration. Customers always appreciate well integrated solutions and the benefits will be even greater for those companies moving their infrastructure to the cloud. Eventually, Salesforce may move their analytics and reporting to the cloud and offer a solution that can work with data across the board and not just their own datasets.
So what’s the right solution for your company? Salesforce and Tableau? Google Suite and Looker? Microsoft’s Power BI, Office, and Azure? The key thing to understand from a business analytics standpoint is that dashboards like these are just one relatively small part of the puzzle. Things like ETL, data prep, and reporting operations are still handled by other tools. This space still has a 90’s era vibe to it. Many companies still push to keep this work in IT but this tends to increase the turnaround times and costs, which is a hard sell in a world where managers want things delivered quickly.
While Tableau and Looker are considered some of the best data exploration applications on the market today, they still feel like an isolated solution for BI managers. This is a very interesting trend that I don’t believe has received much attention in the press. There is a growing realization within the business intelligence community that no dashboard will save the day. Every time you find yourself going back to Excel, it’s a recognition that what many business analysts want is the flexibility to design their own approaches and custom tools that fit in-house problems.
For example, developing internal business applications is also becoming increasingly easy with solutions like Retool, which is part of an interesting new “rise of no code” trend applications. Making internal business tools without a big IT project is not a new idea. MS Access does exactly that, but what is new is that tools like Retool provide a way to easily build web applications with a simple workflow.
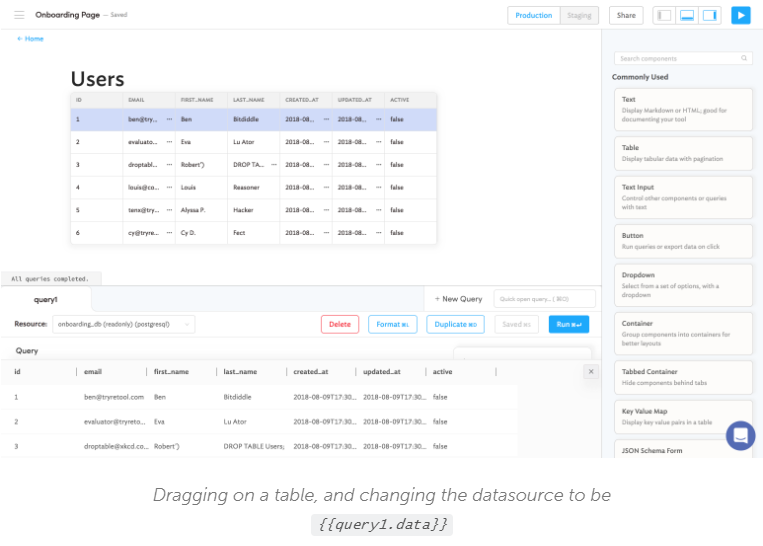
At work, my team and I are using those tools to build Salesforce and business applications. One advantage, in my view, is that it’s a simpler way to build the applications, but the other advantage gets us back to that magic word: integration. With Salesforce, you are locked in the Salesforce world and pulling data from other systems can be hard. Tools like Retool must make connectivity a top priority to survive so they are extremely good at integrating with other applications and databases.
Industry moving to open source tools
Isolated tools and processes don’t last long. Integration to existing processes and solutions is paramount. Tableau did not integrate well with the rest of the business analyst workflow and eventually felt like a very incomplete solution. Salesforce might be a great CRM, but it kind of lives in isolation and is mostly being used by sales organizations, so it can feel incomplete too in a way.
As the analytics industry advances further, it is important to keep this in mind. Any current modern analytic enterprise solution requires the orchestration of multiple tools sold by multiple vendors that don’t always work as well together as needed. This is an interesting opportunity for open source tools and vendors that take integration more seriously. It’s interesting because open source solutions have a natural tendency to integrate well with each other and avoid lock in.
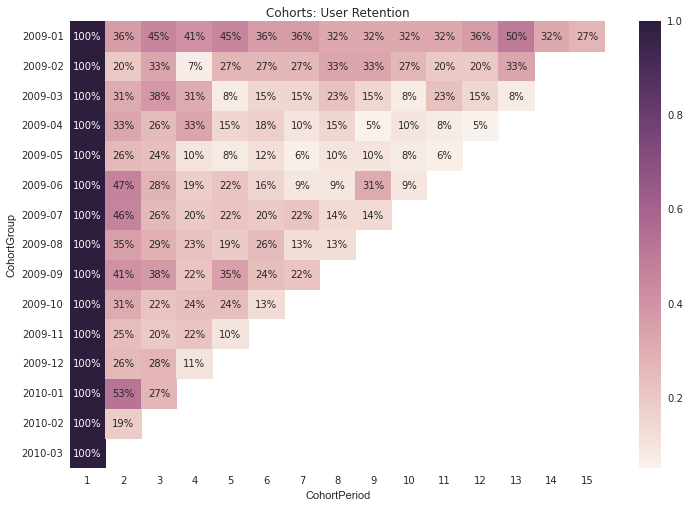
Maybe that’s why Jupyter Notebooks are exploding right now in popularity. They provide the type of live feedback users love with the power of a programming language with a rich ecosystem of libraries like Python. With Jupyter, analysts can connect to pretty much everything, can write to everything, and can output all kinds of interesting things. For example, developers like Greg Reda have been using tools like Jupyter for cohort analysis. This is a good approach when trying to crunch data on customer acquisition and to demonstrate which subset of customers has the best lifetime value. Here you can see how easily he created a cohort chart that looks good after finalizing his analysis:
import seaborn as sns
sns.set(style='white')
plt.figure(figsize=(12, 8))
plt.title('Cohorts: User Retention')
sns.heatmap(user_retention.T, mask=user_retention.T.isnull(), annot=True, fmt='.0%');
Which outputs this nice cohort chart:
Open source is also catching up on enterprise. Vega is a solid implementation of the “grammar of graphics”, a concept to define data visualizations in a declarative way. Vega shares the same theoretical foundations as Tableau, has a Python implementation and is already integrated with Jupyter. Vega is so good that ElasticSearch officially made it an important part of their Kibana visualization platform last year.
OK, but what about analytics and BI in companies? Are we seeing a trend towards adoption of open source tools?
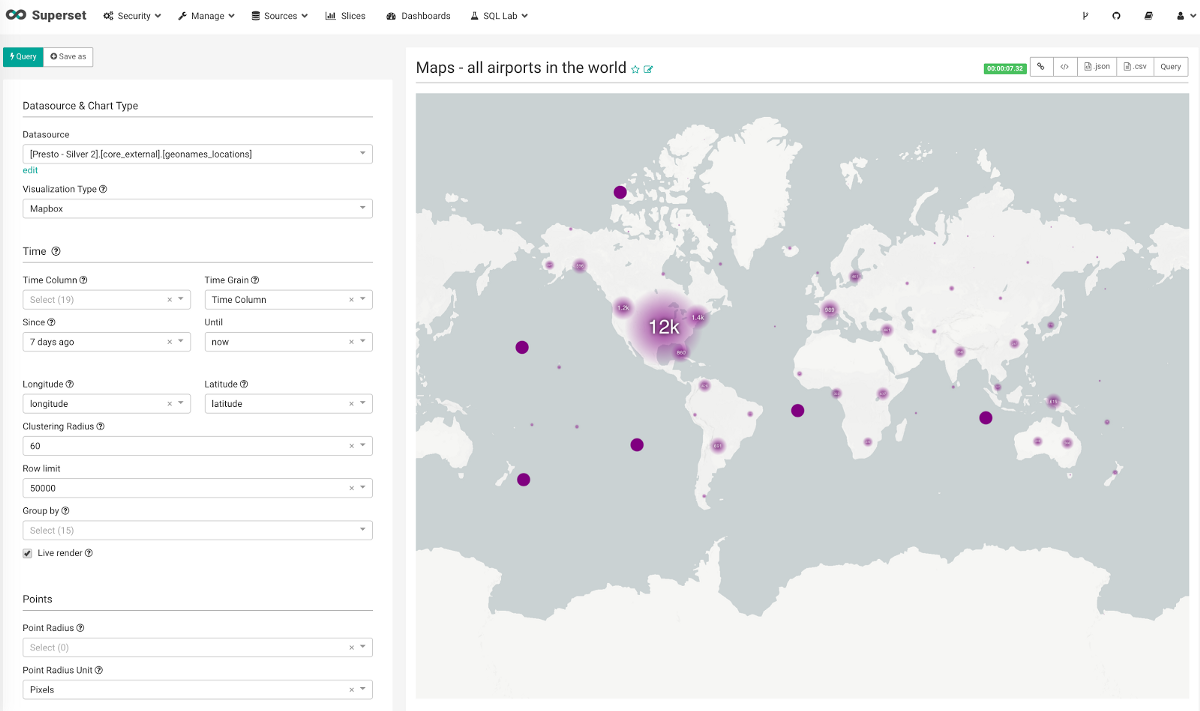
Airbnb is an example of a company that has put together a custom in-house toolkit so that any employee, even those not familiar with coding in SQL, can use data to make informed decisions. They called it Superset and they have open sourced it. Superset is now in the process of becoming part of the Apache software foundation.
Netflix is another example of a company doubling down on open source for BI and analytics. Netflix software engineers even developed their own version of Jupyter called nteract and have few interesting articles on using notebooks in production.
For business analytics managers like myself, the lesson is simple. Management might buy into good looking dashboard tools, but the workers actually doing things with the data need solutions that are easy to customize and integrate. In analytics a complete solution goes from the raw data all the way to the dashboard, the commentary, and the insights. While services like Tableau and Looker are nice, a mastery of languages like SQL and Python will give you the ability to wrangle complex, often messy data into reporting that can be used across your company. New BI dashboards will come and go. More cloud enterprise applications will arrive with great fanfare but mastering the ability to build tools suited to your in-house needs will never go out of style.