
Today we are launching the 2019 update to the Stack Overflow Salary Calculator, a tool that allows developers and employers to understand representative salaries for the software industry based on experience level, location, education, and specific technologies. This is the third year we have released our salary calculator, and we continue to use the same modeling approach from previous years. Our salary calculator is based on the comprehensive data from the Stack Overflow Developer Survey, and this large, extensive survey data allows us to build an accurate model that reflects trends in how coding work is being compensated around the world. The inputs to our salary calculator, what we find most predictive of a developer's salary, are your
- location,
- education,
- years of professional coding experience,
- what kind of coding work you do, and
- the technologies you use professionally.
Geography
One of the factors that impacts salaries the most for people who code is where they live and work. Let's look at salaries for the top five countries for Stack Overflow traffic and respondents on the Stack Overflow Developer Survey.
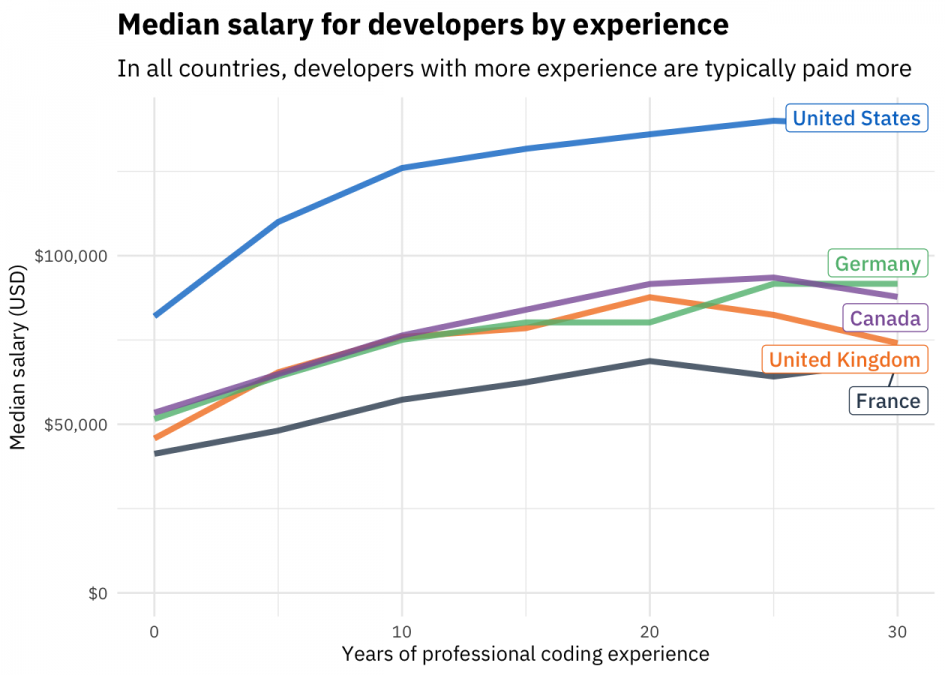
What types of changes do we see overall compared to last year? Looking in detail at last year's model compared to this year's model is a more fair comparison (contrasted with the 2017 to 2018 comparison) because our data cleaning and preparation process was more consistent; we have more confidence in year-to-year trends this year. According to our survey, people who code in countries like the United States and Canada are earning about 5% more this year compared to last year, even controlling for experience and education. The situation in Europe, Russia, Brazil, and India is not quite as positive, with mostly stable salaries this year compared to last, controlling for education and experience. Based on our Developer Survey data this year, we are able to report salary estimates for nine countries in addition to the five shown above:
- Australia
- Brazil
- India
- Italy
- Netherlands
- Poland
- Russia
- Spain
- Sweden
Support for Italy is new this year, so if you are a developer living in Italy, be sure to check out our results! We are also able to predict salary estimates for some specific cities that have different salary characteristics than the countries in which they are located, such as Seattle, New York, and the San Francisco Bay Area in the United States. As an example, our results indicate that people in Paris who code for work earn about 15% more than people in the rest of France.
Earning potential and types of coding work
Another important factor that affects how much a developer is paid is what kind of work they do. Like last year, people working in DevOps are high earners.
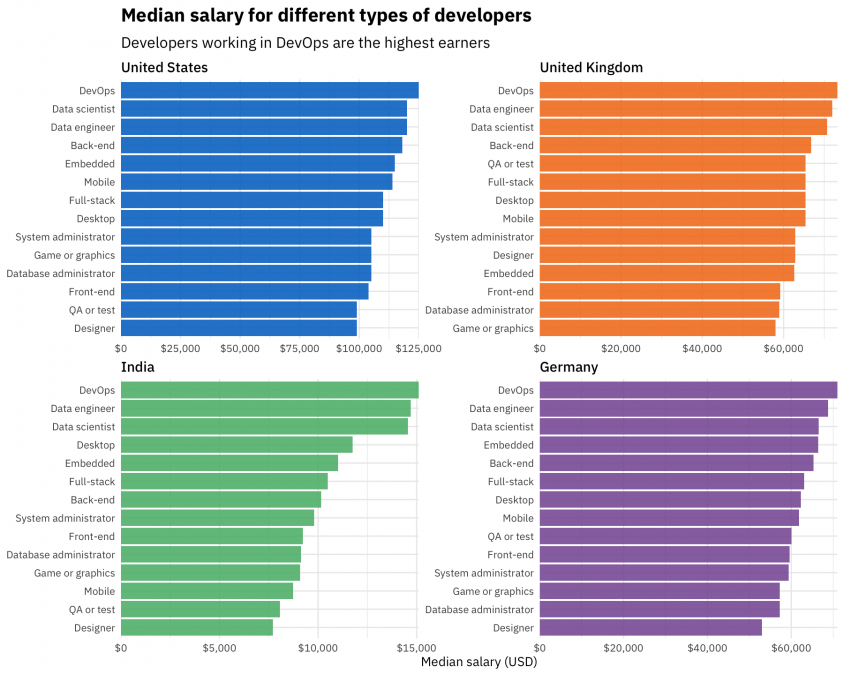
Notice that we see the same mix of developers roles near the top and near the bottom of these plots for each country. Our survey sample is large, but we sample differently along the distributions of experience, education, developer role, and other characteristics in each country. To make accurate and confident estimate for salaries using this data, we build a model that accounts for all of these characteristics at once. This means that we cannot use our modeling to answer questions like whether embedded developers in Germany are paid relatively more than in the United States, but we can pool all the countries' data together to build a more accurate model than we would have otherwise. In the end, some roles such as DevOps are associated with higher salaries, some roles such as game developers are associated with lower salaries, and most are not associated with any change from the baseline salary, i.e. from the typical salary for that country with a given experience and education. Data roles fall into that last category, meaning that we have evidence here that high salaries for data scientists and data engineers can be accounted for by high education and high experience levels alone. Data scientists are highly paid, but not more so than a similarly educated developer doing other kinds of work. (Both bachelor's degrees and even higher degrees are associated with significantly increased pay for people who code.) Over the past several years, data science and data engineering work have been moving away from an extreme outlier position into the mainstream of software work. DevOps-focused work, on the other hand, is unusual both in terms of high compensation globally, as well as job satisfaction, how few DevOps specialists are looking for work, and more. On the 2019 Developer Survey, we gave respondents multiple options to choose from for their professional role, and each respondent could choose as many as appropriate for them. This year, we had two related roles in the operations area: "site reliability engineer" and "DevOps specialist". More respondents said they were DevOps specialists than SREs, but those who said they are SREs earn even more than those who identified as DevOps specialists. For the purposes of this modeling, we combined these two roles into one DevOps role, but keep in mind that people with SRE roles can earn even more. Specific technologies used in coding work also impact salary, even when controlling for developer roles, experience, and other factors. Staying current with high-demand technologies can have a big impact on salary. For example, this year, we see a significant increase in salary for developers who tell us they use Scala, Redis, Go, or Apache Spark in their professional lives. Just like last year, some technologies like WordPress and PHP are associated with lower salaries for developers, and some technologies like JavaScript are used so broadly that they do not affect salary up or down.
Building a model to estimate salary
Like last year, we used multiple linear regression to predict salary from the model inputs, with regularization to help with variable selection. Regularization can help decide which of the many technologies and developer roles we asked about on the survey are important predictors for salary. We modeled salaries are on a log scale, because the salary distributions are log-normal (as such distributions often are) with a long tail of very high salaries. In the salary calculator, we report a predicted salary for the location, education, experience, and other information you enter. Notice that we also report a 50% prediction interval. The specific statistical meaning of this interval is that we expect 50% of people with the same characteristics as you to have salaries within that range; it spans the 25th to 75th percentiles. The interval is just as important as the prediction itself (the 50th percentile), because it gives you an understanding of what the range of expected salaries could be. Similar to last year, we built two models, one for countries with higher incomes and one for countries with lower incomes. We can achieve better salary predictions for developers in all countries with this approach, in terms of how well the models fit the data, compared to either building one model for all countries, building separate models for each country, or other approaches. One way to evaluate how well a model fits data is to look at residuals, the differences between the predicted salaries and the known salaries for the dataset we used for modeling. Let’s look at the residuals for the countries and individual cities supported in the 2019 update to our salary calculator.
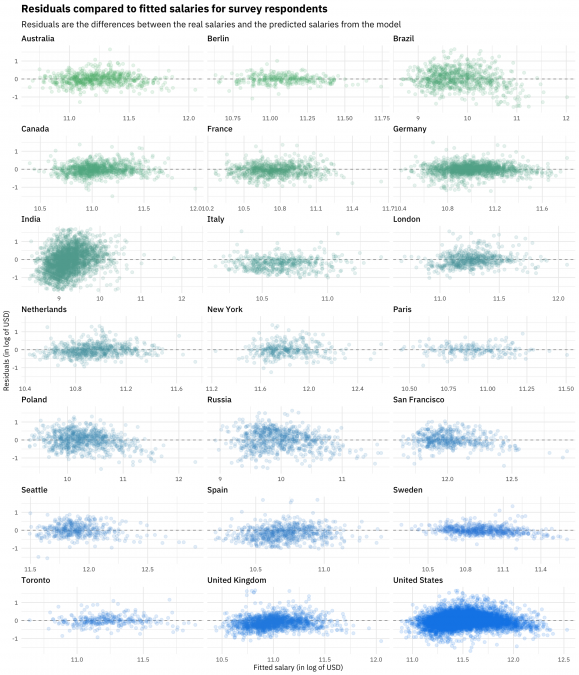
The residuals look pretty good overall, but there are a few things to notice and keep in mind when interpreting the modeling results. First of all, just like last year, the residuals are much higher for countries with lower incomes like India and Brazil than countries with higher incomes like Sweden and Germany. We cannot predict incomes as accurately in countries with lower incomes. Second, notice the shape of the residuals for some countries such as the United States; there is less variation in the residuals at high salary than at low salary. This type of behavior has a special name in statistics; it's called heteroscedasticity, which more generally means that the variance of residuals isn't constant. It means that our dataset doesn't entirely meet the underlying assumptions of our model. In real life, salaries for people who code depend on both the characteristics we have taken into account in our model and other complex factors, some of which involve some violations of the assumptions of our modeling. That's real life for you! These are some of the limitations of our results, but the salaries and prediction intervals that we are reporting in our calculator this year offer reliable insight for developer salaries around the world. This plot shows residuals and fitted salaries in USD on a log scale, but salaries in the calculator itself are reported in natural units and the appropriate local currency for each user.
Try it out
Check out the Stack Overflow Salary Calculator and learn more about what people who code are earning! As a developer, you can explore the range of potential salaries for the kind of work you do and your skills, and find specific recommended jobs relevant for you. As an employer, you can learn more about the hiring landscape today.
Done reading this awesome post? We have something fun for ya. The Stack Overflow podcast is back! Come check it out or listen below.