
At Aiven, we provide open source data platforms as managed services on multiple cloud platforms. That comes with a 99.99% uptime service-level agreement (SLA), which is a tall order. We need to continuously monitor our systems, so if things do go wrong, we have all the information we need to fix problems quickly. M3 is the foundation of our monitoring platform, storing all our metrics, and we chose it because it was the best heavy-duty option.
That wasn’t always the case. Before M3, we were running with single-node InfluxDB as our backend time series database (TSDB), but the increasing number of nodes and metrics we collected began to show the boundaries of the setup, forcing us to find something new that could scale with our needs. Here’s how we decided to migrate from InfluxDB to M3, what we needed to achieve with M3, and how the migration went. Let’s get started.
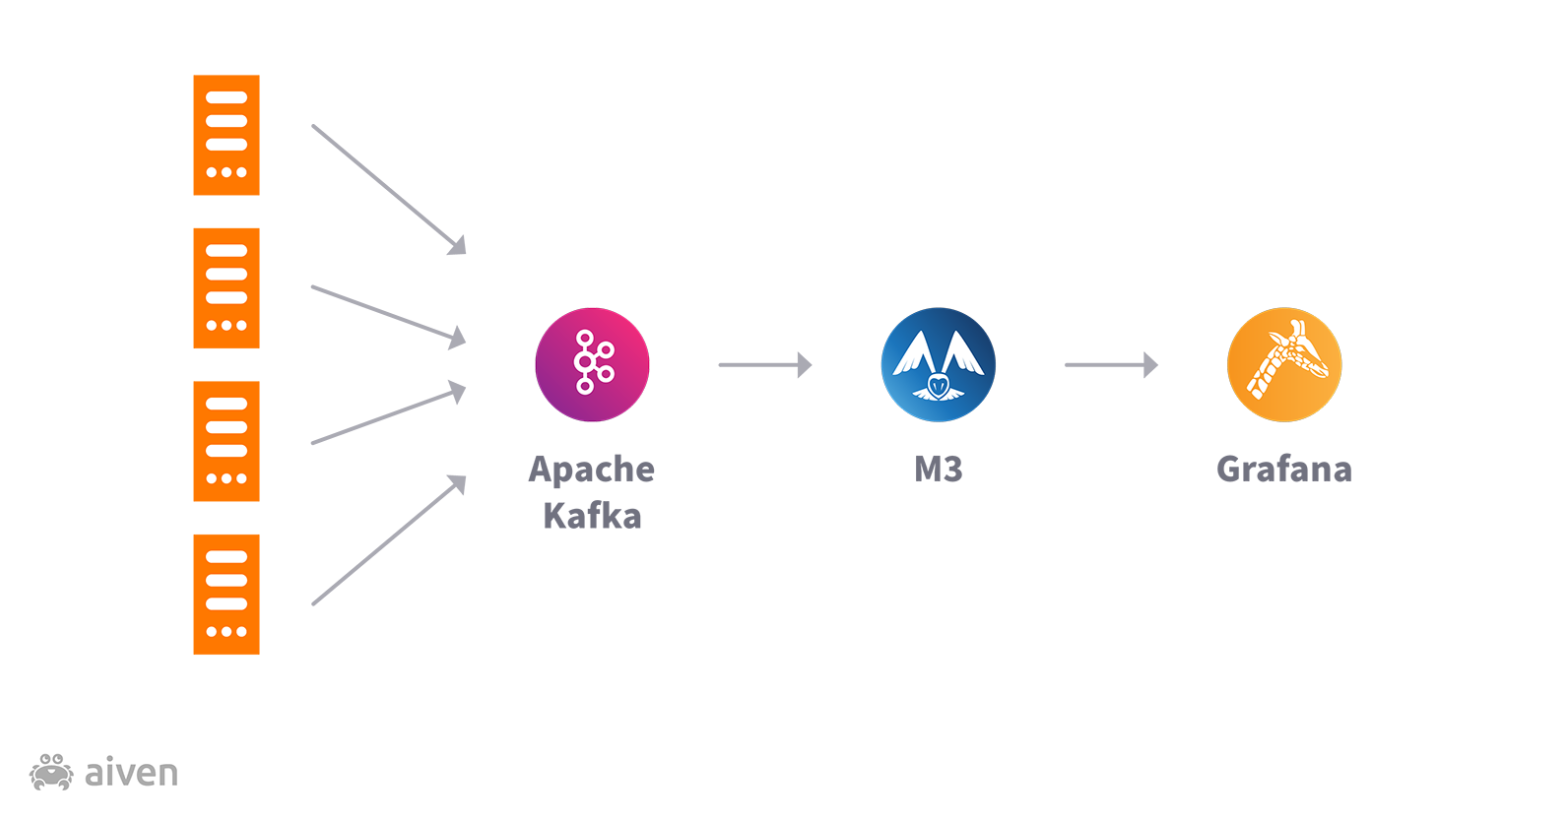
Aiven’s platform generates a huge amount of data: we have tens of thousands of nodes running, and we collect thousands of metrics for each node. Metrics are sent to Kafka using Telegraf. Once the data is in Kafka, we then distribute it to various metrics backends, internal or external, again using Telegraf. The final piece of our observability platform is Grafana, which enables us to both visualize metrics trends and set up alerts on top of the time-series database.
Outgrowing single-node InfluxDB
InfluxDB used to have a reasonably open license, and it was deemed acceptable (and it was quite popular and familiar) back when Aiven started. The cluster mode license wasn’t right for us (as we want to also offer as a service whatever we use internally), so we were stuck with a single node setup.
Towards the end of our InfluxDB-based architecture, that single node hit the size limit on a machine with 96 CPU cores without really being able to keep up with the flow of metrics or even back up the DB safely. To keep the platform running, we were forced to reduce the volume of reported metrics, mostly by increasing the scrape intervals so that we would only push metrics into InfluxDB at a rate the database could keep up with: 60s/120s depending on the criticality of the nodes. This setting is far from ideal; enabling an observation every 60s/120s means that we didn’t have immediate visibility on problems and therefore couldn’t react quickly enough. Keeping such long polling intervals wasn’t an option; we needed a platform that could support our growth and not limit our data collection in any way.
Evaluating our options
We started looking for alternative solutions in early 2019: InfluxDB high-availability multi-node features were not open source, making that a no-go for us. We operate exclusively on open source platforms by choice and make many of the solutions that we use to operate at scale available to our customers.
As mentioned above, the drivers for our research were open source status, scalability, and ease of management. We wanted to use a platform that could solve our problems and do the same for our customers.
We considered Graphite, an older project (started in 2006) written in Python, and one of our favorite tech stacks. We knew it would be possible to scale, but that doing so could be painful as it’s a set of daemons without a good scalability story written in Python instead of a more performant language like Go. TimescaleDB was another option, and we are big fans of PostgreSQL, off which it is built. It offers high availability, but since it isn’t horizontally scalable, we decided TimescaleDB wasn’t the long term solution we needed.
Another option was Prometheus, which despite having no built-in high availability, does provide options for federation. The large ecosystem around Prometheus means that it’s tested in real situations and maintained by many, so it has been evolving in the last few years. Other time series databases have become more popular; they are essentially TSDB backends for Prometheus (including others we considered and the one we eventually decided on). It’s become something of a de facto standard (not to say other TSDBs aren’t doing good work), but there's a reason most of new projects I see in this space these days are part of Prometheus ecosystem.
Cortex was also evaluated but considered relatively complex to adopt and manage. Thanos was also considered, but its heavy reliance on object storage meant that it could be an expensive option for metrics use cases we had in mind. The newcomer VictoriaMetrics wasn’t available during our discovery phase but would be an interesting tool to evaluate.
Why did we choose M3?
M3 has an elegant architecture with three separate services—`m3db`, `m3coordinator`, and `m3aggregator`— each one of them taking responsibility for a precise action: storage, coordination, and aggregation.
We knew that scalability would be our biggest challenge because our platform is growing so quickly. The main beauty of M3 is that we can scale each service horizontally as needed. Having multiple instances of each service also means that we avoided a single critical point of failure in our setup: with a large enough cluster, every service has a failover option in case of problems.
Out of the box M3 data handling is also a big plus: the possibility to define aggregations on top of raw data makes downsampling just a matter of a terminal command. Specifically for metrics use cases, this is a welcome feature, enabling us to store raw data (30 seconds samples) for the most recent period and aggregated data (2-5 min) for long term. The data can be compressed at rest, but we also implemented in-transit compression of traffic to optimize the usage of network resources; M3 perhaps naively assumes that traffic to `m3db`and `m3aggregator` is in the same cluster and therefore free. To ensure high availability, we ran these distributed across availability zones, but that meant a 20-50x increase in bandwidth which we found quite unsatisfactory, as we had to pay for it in some of the cloud providers we support. The raw data amounts were large enough to cause lag—the service could not keep up with the data ingestion as we ran the cluster connectivity inside IPsec tunnels. We hope compression in transit will be available upstream in the near future.
The last point in our evaluation was represented by trust: we knew we wanted a proven open source option for our platform, and M3 is actively maintained by Chronosphere and other third-party developers, including Aiven. We knew that companies like Uber, Walmart, and LinkedIn were using M3 successfully. These factors gave us the confidence that M3 was the right option for us.
Pain points of migration
We didn’t have to change the overall architecture when moving from InfluxDB to M3. We still monitor the metrics of every internal and customer node. However, we had to change a few things elsewhere in our pipeline to successfully transition from InfluxDB to M3. Just because we could keep the existing architecture in place doesn’t mean there weren’t struggles.
The biggest task was migrating hundreds of our Grafana dashboards (each with multiple panels) from InfluxDB query language to PromQL (Prometheus query language). This was a painful experience—we developed a tool to automate this, but that took over a year of on-and-off work—but worth it in the end. There were other, smaller tasks as well. In particular, we had a lot of hard-coded assumptions in our admin tools about using InfluxDB either directly or as a data source, so quite a few updates were needed there too.
Another pain point was the lack of great tooling for backing up and restoring M3 databases. We developed our own tool for this, called Astacus, and open-sourced it. Astacus supports cluster-wide backup and restore of all M3DB data on disk, and a subset of etcd state for the cluster containing the M3 metadata about nodes and shards.
Lessons learned
There are a few lessons we’d like to share from our journey, starting with advice about metrics. Having a clear focus on the metrics you really care about is key. A year ago we tracked more time series metrics than we do now, despite the business growing. But as part of the migration to M3, we took the time to review and refine which metrics we track. We cut out half the metrics per node and can now handle twice the nodes at the same cost.
Our architecture helped with that as well, since every node pushes metrics to Kafka, which gives us a common location to filter metrics. This decoupling of metrics sources and consumers via Kafka helped us a lot, especially in managing the transition, since we could easily run M3 in parallel with InfluxDB—and we did, for over a year before finally switching. We also learned that compressing network traffic is critical if you want to save on bandwidth (and cloud bills) in large clustered services like ours. M3 version 1.3 includes one of our compression patches.
Aggregation in M3 is surprisingly resource-heavy, especially regarding memory. We initially used daily and weekly aggregations in addition to our unaggregated data, and it tripled the memory requirements of the nodes. We now run without the aggregator and instead use unaggregated metrics with a long retention period. This makes queries over longer time periods slower, but is less of a problem than the memory impact that we saw with aggregation in place.
Happily, some things have improved since we trod this path. M3 configuration is pretty complex, and because documentation was sparse when we implemented M3, we learned a lot through experimentation. Fortunately, documentation has since improved.
Some interesting Aiven M3 production deployment facts
A few facts we want to share with you about our M3 setup:
Almost everything we use in our own stack is open source, so that was one of the main criteria in choosing M3 back in early 2019. Once we found something that could handle the size of our own metrics, and once we checked that it really did work well for us in production, we started packaging it so our customers could use it too.
We communicate with M3 using the compressed InfluxDB line protocol, since (at least at the time of evaluation) it was more performant than the native Prometheus write. We contributed to the M3 implementation of the InfluxDB write protocol, something we needed for ourselves and were proud to share.
- Currently, we have ~20 million unique time series (with replication factor 3) at any time
- We use two clusters for M3
- 6-node `m3coordinator` (64GB RAM each)
- 9-node ‘m3db` (150GB RAM each)
- Uncompressed raw backup size is ~8TB for two weeks worth of data
At the risk of tempting fate, the production monitoring cluster hasn’t had any downtime in nearly two years that wasn’t caused by humans misconfiguring things (oops!).
Open source at Aiven
At Aiven, we live and breathe open source solutions. Our Aiveners publish and maintain half a dozen projects and connectors through our Open Source Program Office. We aim to make every service we use internally available to our customers as well. We avoid non-OSS solutions where possible, as this precludes making these solutions available to our customers too. We also see ourselves as “insiders” in the open source projects we use: we contribute to and advocate for the projects as well as deploy and operate the projects on our own platforms.
Implementing M3 for our own monitoring led us to contribute to the implementation of the InfluxDB protocol in the project. We built Astacus, the backup and restore tool that we need for M3, and made it open source for others to use too. We implemented compression on data in transit, and are working on adding that to the upstream project, with the first of the patches available in the 1.3 release.
If you’re interested in integrated M3 in your project, read more about Aiven for M3 in our developer portal.