
What do you do when an API returns something unexpected? Is the issue user inputs, the API itself, or something completely unrelated? For API consumers, debugging means identifying and fixing issues with a single API call or sequence of calls. In many cases, you are debugging code that you might not control, and you are at the mercy of what is observable. In addition to experiencing unexpected behavior while accessing an API, you can also make mistakes parsing the output or passing through variables.
In this article, let’s dig into methodologies and principles for debugging REST APIs more quickly and reliably.
What is API debugging?
The debugging process aims to understand the relationship between inputs and outputs. Most of the effort goes toward locating the root cause of the issue based on what can be observed. This can get tricky if you are stringing together a sequence of API calls from different providers or accessing different resources.
Ideally, you have a robust testing and monitoring system to alert you when something goes wrong and pinpoint where the problem might be. But even if you don’t have this level of observability, a consistent approach can reduce the time and effort required to find and fix issues.
Here is one approach to identifying bugs:
- Isolate the API issue
- Check the status messages
- Inspect the data more deeply
I’ll demonstrate these debugging examples in Postman, but feel free to use your favorite developer tool or API client.
Isolate the API issue
The first step is to isolate the API issue and determine if the issue stems from calling the API, the API itself, processing the output, or something completely unrelated. Reproduce the issue in your favorite developer tool or API client for deeper inspection. This allows you to more easily inspect and tweak the request parameters, headers, and body to compare against the response. If you can’t reliably discern a relationship between the input and output, the problem may not be with the API call itself. For example, there might be a third-party service or a change in infrastructure causing the unexpected behavior.
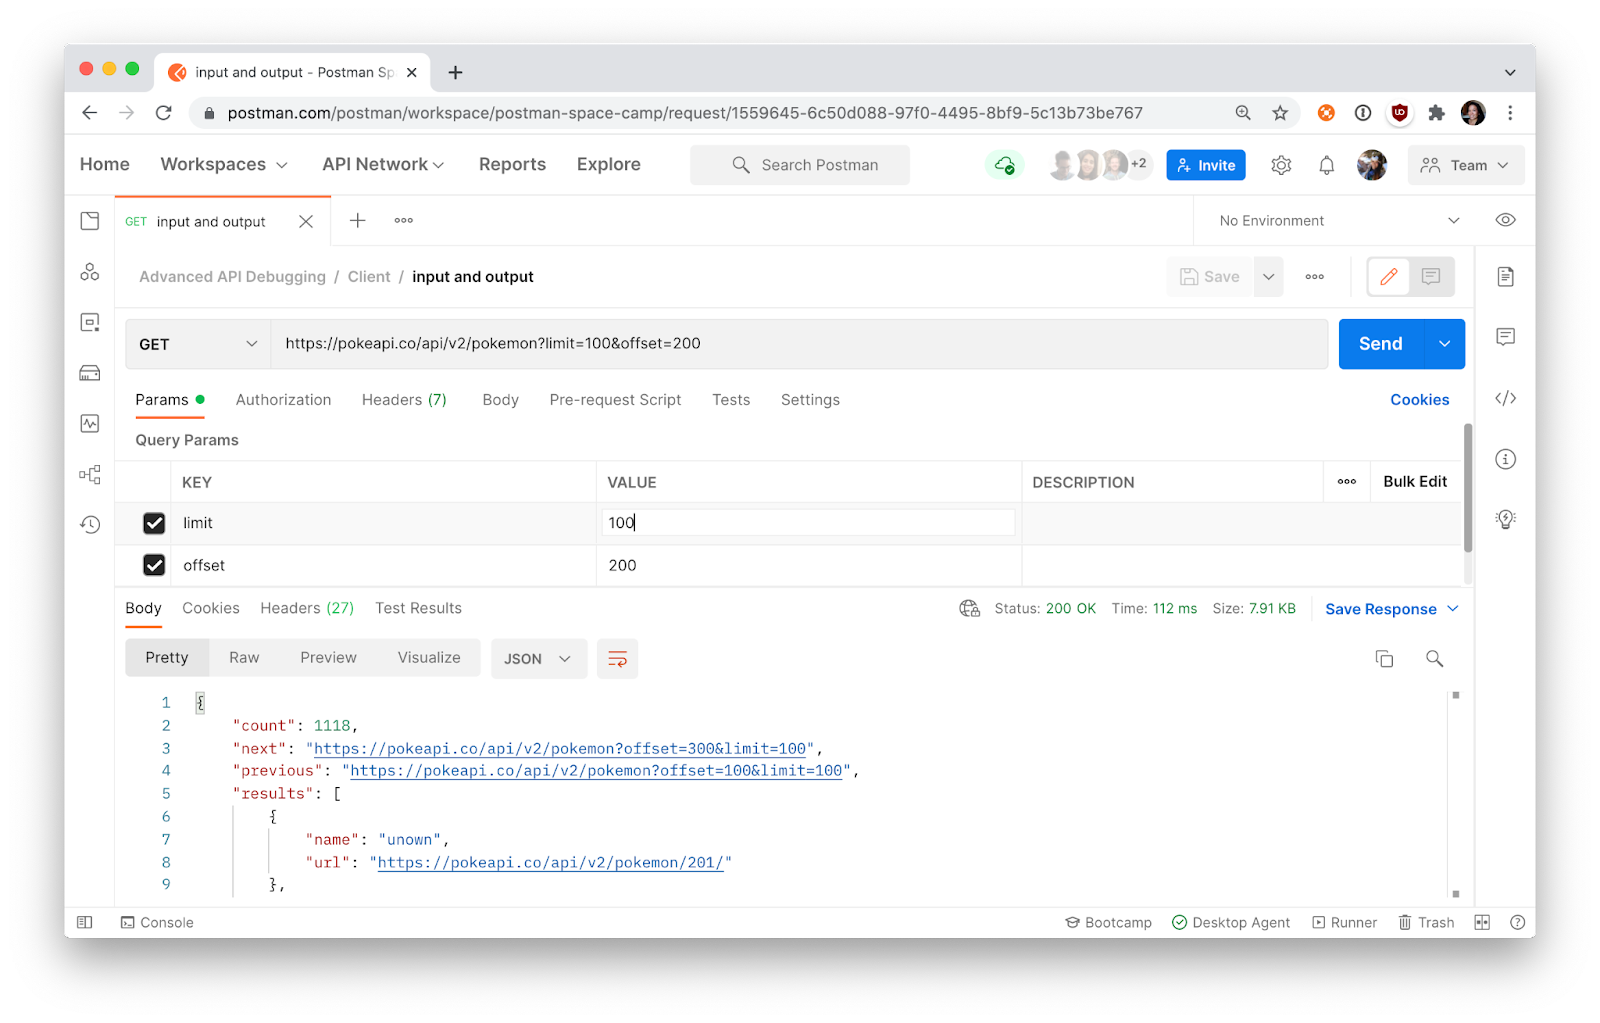
If you want to import an API call into Postman, you can paste a cURL command as raw text. You can also capture a sequence of calls with a proxy for replay or recording.
Check the status messages
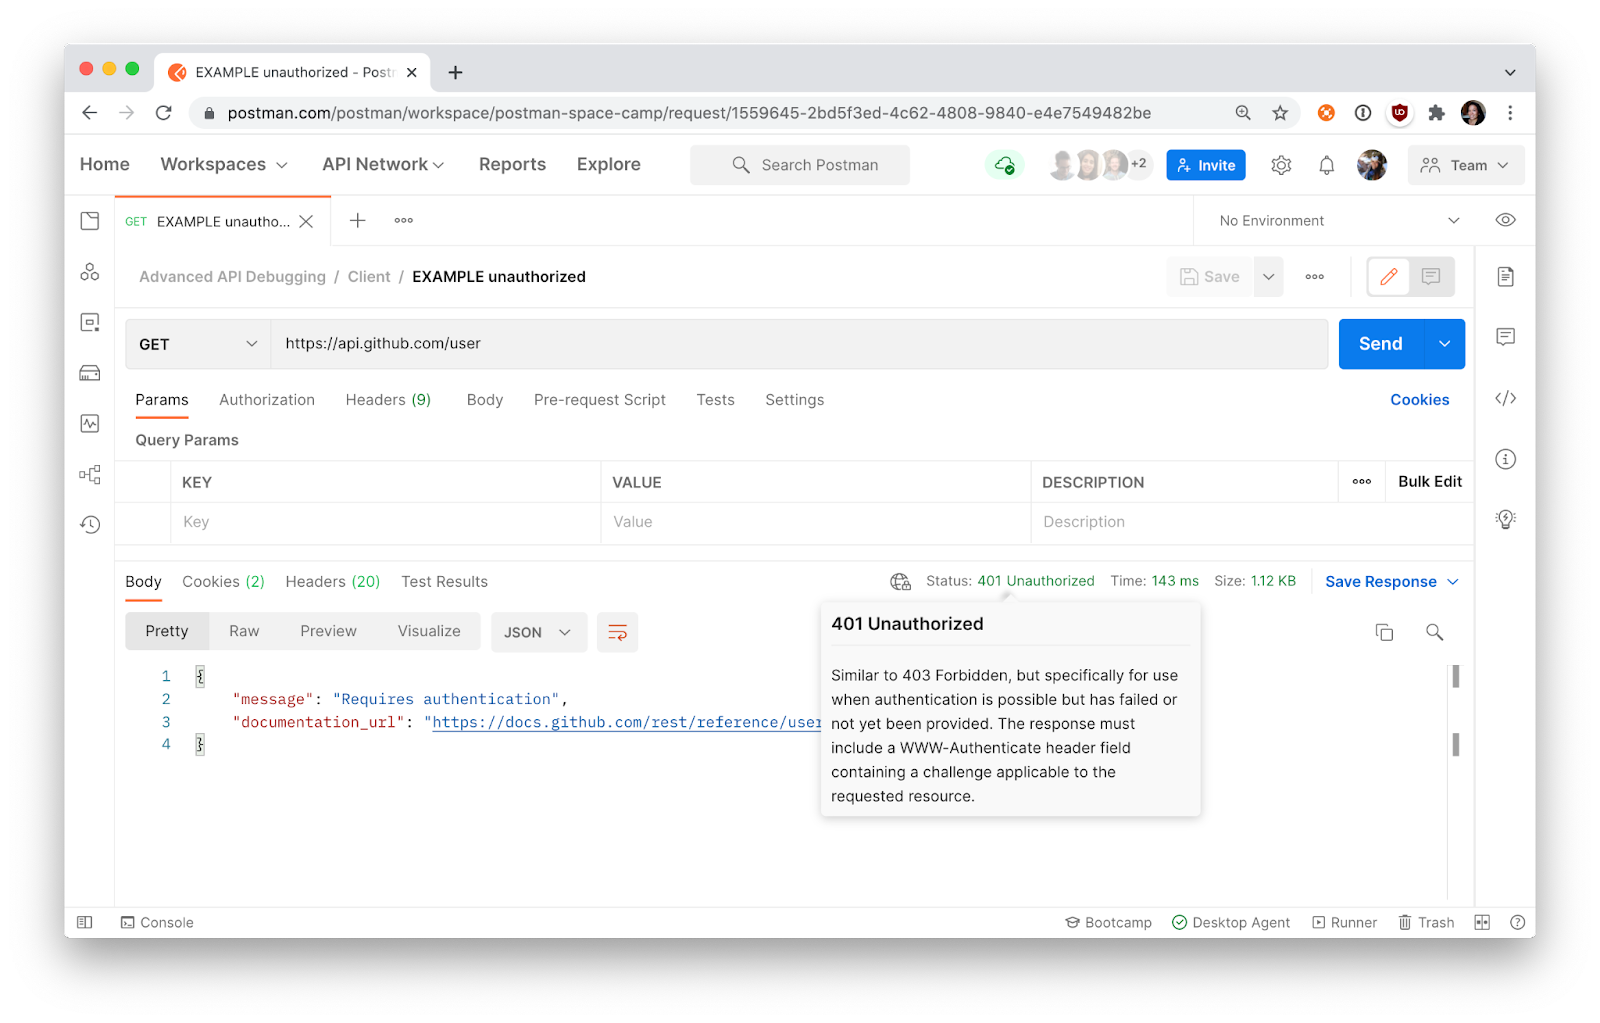
When you’re talking to an API, the server returns an HTTP status code that signals the status of your API request. Status codes and error messages are determined by the API provider, so they vary in meaningfulness and accuracy. But most API providers follow the established convention of defining the class of response using the first digit of their status code. For example, status codes in the 400s indicate an issue with the client. This means that you can update the request to potentially solve the issue. Status codes in the 500s indicate an issue with the server. Besides verifying that you are accessing the proper resource and checking back later, there’s not much you can do unless you are also the API provider.
Assuming the server returns reliable status messages, this is our first clue to tracking down the source of the bug. Here are some common client error codes in the 400s and what you can do when you encounter one of these errors:
- 400 Bad Request: Look for syntax errors like typos or a malformed JSON body.
- 401 Unauthorized: Verify that you have valid authentication credentials for the target resource and check your syntax for header values.
- 403 Forbidden: Check your permissions and scope to ensure you are authorized to access the resource.
- 418 I’m a Teapot: May indicate the request is one the provider does not want to handle, such as automated queries.
- 429 Too Many Requests: Check the documentation to understand the rate limits or try again later.
Inspect the data more deeply
The next step is to dig deeper and validate your assumptions. You can validate that you have formatted each request properly and parsed each response correctly. You can also validate that variables are defined and referenced properly as you pass data along a sequence of API calls.
Here are common issues when dealing with HTTP APIs:
- Malformed JSON: Newcomers make some common mistakes when sending JSON bodies. Single quotes are invalid within the JSON string, so make sure you surround strings and property names with double quotes. Additionally, comments are not supported by JSON, so either minify them or don’t add them at all.
- Serializing data: REST APIs frequently store and send data as JSON objects. For the data to transmit properly, make sure to encode the data with
JSON.stringify()and decode it withJSON.parse(). Additionally, servers may require that you set aContent-Typeheader with the value ofapplication/json. Upon further inspection, if you see values like[object Object]orUnexpected token, this indicates improper serialization and deserialization. - Type casting: Values can be cast from one type to another as you prepare to send a request or parse a response. Depending on the programming language, performing a math calculation on a
stringmay fail, but casting the value to anumberallows you to work with the data. - Extracting information: Once you deserialize a JSON response using
JSON.parse(), you can access properties with dot or bracket notation and loop through arrays. If you are trying to access deeply nested information within a complex structure, you may need to break it down step-by-step to precisely reference that information and guarantee that you are not trying to drill deeper into something that isundefined. - Authentication vs. authorization: Authentication verifies users are who they say they are, while authorization confirms that users have permission to access a resource. If you have the proper authorization header(s) included with a request but still cannot access a resource, doublecheck the permissions and scopes associated with your credentials.
- Content type headers: The
Content-TypeandAcceptheaders facilitate the content negotiation between client and server. AContent-typerequest header tells the server what type of information is being sent from the client. On the other hand, anAcceptrequest header tells the server what type of content the client can understand. Some APIs require specific request headers and only work with certain content types.
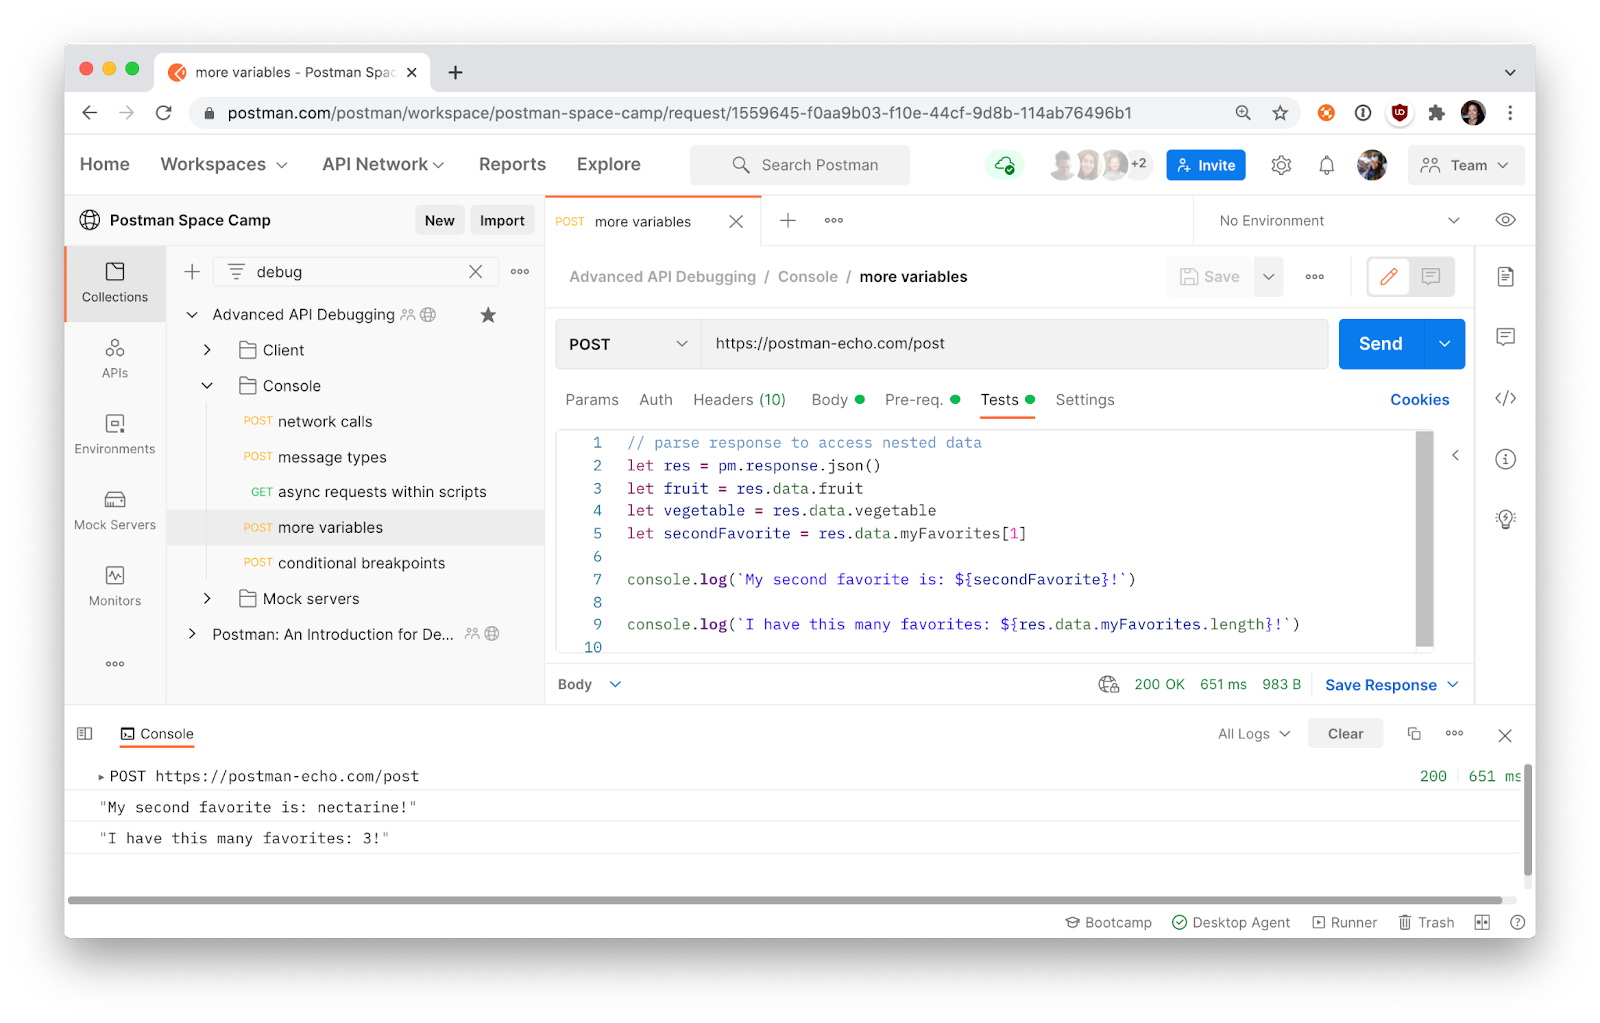
With these common errors, you can rely on syntax highlighting, linters, and other inspection features to provide more visibility into issues. Developer consoles can also provide more visibility into your application’s network calls and log statements to further help you isolate issues with inputs, outputs, and passing data from one call to another. For example, if you have a sequence of synchronous or asynchronous calls, logging values at critical junctions or setting up conditional breakpoints can help you quickly pinpoint the issue. Using console statements like console.log() throughout the call execution can further validate your assumptions parsing outputs.
Types of debugging strategies
A number of debugging strategies can narrow down the cause of the issue. These strategies fall into three general categories.
Brute force strategy
If you have limited observability into a system, this means that you are tweaking and logging everything. Adding strategic log statements at certain points throughout a sequence of API calls can be helpful. However, the volume of logs has diminishing returns as it takes more time to interpret the logged data.
Backtracking strategy
This strategy refers to moving backwards from the point where an error is first observed to find the root cause. Similarly, you can start from an API call that is displaying behavior you expect, and then step through subsequent calls until you find the bug. This strategy works well when you have reasonable hypotheses of what might be causing the problem, but is less effective when the error is far from the root cause.
Divide-and-conquer strategy
In complex systems, breaking the system into smaller sections may allow you to spot problems more easily.Binary search is one example of this strategy, where you input a log statement or breakpoint in the middle of a longer sequence of calls. If the defect does not occur by that breakpoint, repeat the process with the second half of the calls, and so on. Another strategy is to use mock servers to isolate the system under test. You can rely on mock responses to stub external dependencies or provide a starting point for your scenarios.
Get in the debugging mindset
After a while, focusing on a problem without making progress can become counterproductive as you lose sight of the forest for the trees. The following tactics can help you get in a more effective debugging mindset.
- Rubber duck debugging: Articulating the problem and hypothesis to someone else may shift your own perspective by forcing you to slow down and explicitly state your assumptions.
- Switch from a focused to diffused mode: Switching to a different activity altogether, like taking a hike, moves your brain into a different gear. The diffused mode of learning is when your brain passively establishes new connections and may result in creative insights. This is one reason why you get the best ideas in the shower or when you first wake up.
Save time and heartache while debugging
Whether you are new to consuming REST APIs or a seasoned veteran, a consistent and methodical approach to debugging saves time and heartache. The debugging strategy you choose depends on the observability of the system. If your system has extensive monitoring in place with predefined logs and stack traces, you can uncover issues quickly and may be able to spot the bug right away. If these measures aren’t in place, you can simplify the problem to reduce the search area and utilize some of these debugging tactics for more visibility.