
SPONSORED BY SUMOLOGIC
Google's most recent Accelerate State of DevOps report found that more than 26% of dev teams can be considered “elite performers.” This number is up from 18% in 2018. According to the DORA (DevOps Research and Assessment) metrics, elite performers deploy software multiple times per day, have a lead time for change and a restore of service in under an hour, and keep their change failure rate under 15%.
Compared to low performers, elite performers deploy 973x more frequently, have 6750x faster lead time, and reduce change failure rates by more than 3x. When there is an issue, elite performers are able to recover 6570x faster than low performers.
Throughout my career, I’ve had the benefit of working with more than a few elite performers and many who were not. Most organizations fall short not because they are unaware of the best approach, but because they struggle to change their culture or find a formula for success in difficult-to-mature processes. They don't always understand their own systems.
Knowing what traits elite teams tend to have and how those traits impact productivity is important. What the metrics above don’t tell us is how these elite teams are able to achieve these outcomes and what enables a lower-performing team to evolve into an elite one. While it’s nice to know what success looks like, developers and engineering managers want to understand what they can do to upgrade their capabilities.
For those organizations that do upgrade their processes, accelerating innovation relative to their market competition becomes easy to maintain and even accelerate. Successful organizations today build highly observable systems and use that observability in the development process to improve their overall velocity. Think test-driven development on steroids.
In this post, I’ll offer some insights into what I believe are the most important building blocks in becoming an elite performer.
Process capability: The secret of elite performers
Early in my IT career I was an instructor and consultant implementing CMMI (Capability Maturity Model Integration). In one of my classes, I had a rather eccentric engineer who would challenge me to defend my reasoning on nearly every topic.
I wanted to have him thrown out of my class but decided instead to let him co-instruct and share his experiences with the class. That judgment call made the course one of my most memorable and fostered a friendship I consider still one of the most influential of my career. We spent many hours debating (both at and after work) and the knowledge he shared with me has had an immeasurable impact over the years.
On the last day of the course, he brought me a copy of the Standard Handbook of Industrial Automation. In the 1986 edition of the book, he highlighted one phrase, “Measuring Process Capability,” and added a handwritten note that said, “This is all you’ll ever need to know.” I can say with confidence that this statement has held true over the past 30 years.
Elite performers have a strong culture in process engineering. Process engineering covers the design and implementation of processes that turn raw materials—in this case, customer needs and software engineering capabilities—into business products. Elite performers are great at defining, measuring, and improving processes. Each of these is important to the process: good design and good specifications define what the application should look like in production; metrics, monitoring, and now observability let you measure how your actual application compares to the design; and harnessing that feedback allows you to design new features or refactor code to improve the application.
There’s a single metric you can use to measure how well your process matches your design. Process capability is a measure of the variability between customer requirements laid out in the design docs (the voice of the customer) and the actual performance of the process (the voice of the process). It can be expressed as follows:
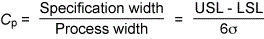
Specification width is the difference between the upper (USL) and lower bounds (LSL) of a process metric as defined in the specifications. The process width is that same differential except in production processes.
So then, for any metric, we’re defining the upper and lower specification limits and evaluating how often those metrics violate the limits. Does this sound familiar? It should. Take a look at any SRE’s service-level indicators (SLIs) and objectives and you will find the idea of error budgets and burndown are rooted in Cp. Also, because this process is focused on improving the quality and efficiency of our processes, it means we ought to be thinking about the quality of our data and the size of our sample sets.
We can look to control theory—the basis of modern observability—for help in engineering our processes and for guiding good coding practices to support those processes. The metrics that we are measuring in Cp are evaluated based their consistency, or how well they remain within a defined performance corridor (the range of acceptable values). For a microservice architecture, for example, we would want the golden signals to be predictable within our performance corridor.
We want API response times to relate to customer experience (CX). If response times are all over the place, or we make it hard to discern why a call is slow vs. fast, it’s impossible to know if CX is good or bad. So it’s vital that we avoid lazy coding such as getAll() type statements, which flood calls with unpredictably large amounts of data. Instead, we might leverage pagination to control our results set, and in doing so, we create a predictable API. If we find we are making too many calls, we may pre-fetch more data asynchronously or elect to change the UI so we queue heavy requests and return them once processed. Ask yourself next time you’re designing a service these questions:
- What is the response time required to ensure good user experience? Perhaps APIs must respond in less than 250ms or not to exceed 500ms.
- What upstream or downstream dependencies could derail performance? Can we overcome them?
- How will we design the code to exhibit deterministic behavior? Are there standards or patterns we can use?
- Can we use circuit-breakers or other design patterns discussed here on Stack Overflow to improve performance or handle failure states without impacting performance so much that we end up doing more harm than good?
- What attributes on API calls will we use to derive metrics in order to ensure we analyze and bucket the things we track like-for-like? Things like separating
POST,PUT,DELETEoperations and understanding which attributes are responsible for requests taking one code path vs. another through our services (and capturing them).
Note: The higher the cardinality on telemetry the better. The more attributes we use to understand performance, the easier it is to understand the source of deviation related to a change when it occurs thereby increasing Cp.
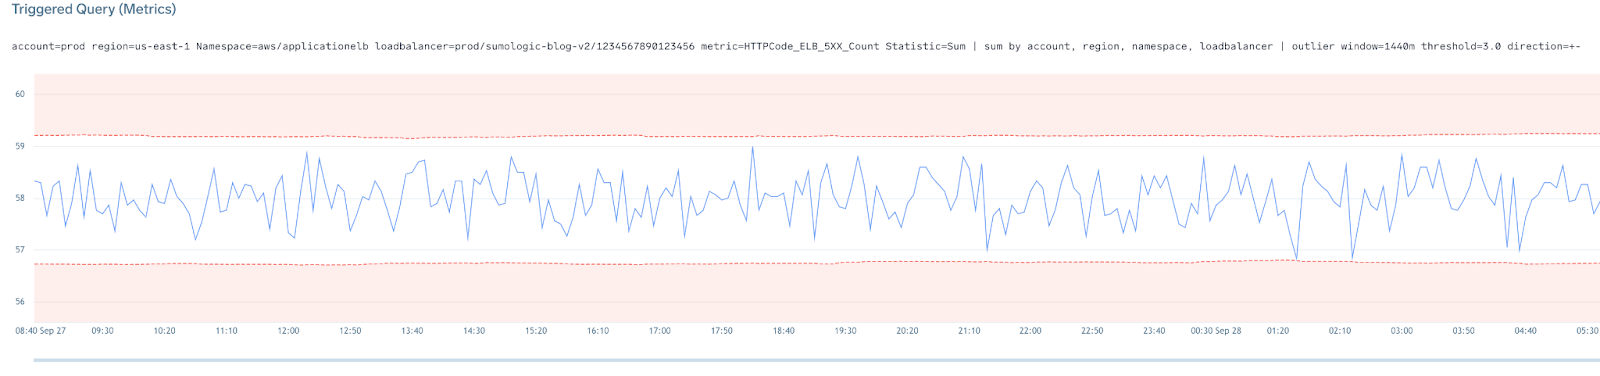
Deterministic code exhibits predictable response times for a given load. Well-written services will exhibit a consistent response profile over time and as load increases. If the load increases beyond the breaking point, we will likely see a spike in errors right around the time we see response times hockey-stick as dead-locks and other thread contention problems.
The smoother and more consistent the metric over time, up to the breaking point equates to high Cp provided you can readily discern the cause.
Knowing that a process will reliably produce metric values that fall within a narrow corridor (ideally not more than two or three standard deviations between the LSL and USL) helps us plan for the outcomes that we want and will aid in better automated remediations (via AIOps and MLOps). Everything we do related to building, testing, and shipping software, over time, should improve Cp, reliability and our ability to predict outcomes. If you find yourself with a great deal of technical debt, or you're on a team that has had to declare bankruptcy on new feature requests, the best way to combat this and get out of debt is to focus on improving your process capability.
To improve process capability, you will want to tighten the feedback loop in your software development lifecycle. This means knowing the voice of your customer and being able to consistently measure the voice of the process(es).
Here’s a list of things you can start doing today that will help you focus your efforts in digging yourself out of debt. If you’re not deep in debt, these are good preventative measures to help you avoid deep technical debt long-term.
- Break your services often. Understanding the failure states of your services is vital to knowing where you need to optimize code and infrastructure. I’ve seen customers improve the efficiency of their services by 300x or more simply by breaking their services. Know your peak throughput in transactions per second and per node. Understand scaling factors when the cluster has many nodes (or pods). Can you optimize code to reduce time on CPU? Are there threading issues, singleton issues, or class-loading issues causing thread wait? Are you async everywhere you could be?
- Publish mocks for the APIs you write. Get your downstream producers to do the same. Simulate failure states like slow response or no response with mocks vs. relying on systems downstream. You’ll find you don’t need a robust environment to break your services or expose many problems very early on in doing this.
- Soak your services. Leverage break-testing to find the break-point in throughput, then back off 20%. Run this load for extended periods on a periodic basis. Do things stay reliable over a period of soak-testing? Find the failures and resolve them.
- Identify your canaries. Use this time to define the few key metrics that will with accuracy infer the health of the service, what will their upper and lower specification limits be? What will be the runbook for when they are outside their limits?
- Automate break-testing as part of the CI/CD pipeline. Continuously battle test your code.
- Use your peak throughput to set a limit on the number of sessions. Scale out before you reach these thresholds. If scaling out fails, is it not better to tell a user your too busy to service their request than to offer them a degraded experience?
- Chaos engineer your end-to-end stacks. What if x happens? Form several hypothesis as a team and throw $5 in a pot to the winner. Be creative, find the weaknesses and fix them. Improve the game theory in how you run your stacks and celebrate findings.
- Eliminate work queues. Look for where you have latency in relying on other teams, reorganize, go to crews/squads models—do what you must to be as self-service as possible. Analyze your processes, define your measurements, and set OKRs to improve them over time.
- Track the time it takes to make decisions. Does it take several weeks to decide something? Once decisions are funded, how often are they scrapped or deprioritized? Are these metrics being consistently measured?
- Find repetitive manual tasks, then automate them. Reduce churn and toil every where it exists.
Measure to the right number of 9s (e.g. 99.99%) for your services and start using error budgets. In other words, don't rely on averages. Instead, leverage top percentiles (TP), histograms, and the number of times things fall outside the median distribution and specification limits. Turn these into budgets, so when your error budget is healthy, you're good to continue or even accelerate change to production. If your budgets are falling or below acceptable, it’s time to slow down and focus on stabilizing and reducing risk. Refactor code as needed to reduce the outliers and improve predictability.
There’s a great project on Github called OpenSLO that enables you to declare your service-level indicators (SLIs) and objectives (SLOs) as code by generating the rules using SLOGen. Doing this enables you to leverage Terraform to deploy SLIs and SLOs and generate the dashboards, metric rules, and alert thresholds as part of your deploy. Sumo Logic recently released full integration with OpenSLO and enables customers to automate and keep consistent service-level management for their services. In this way, deploying reliability management for your services can become fully automated so they stay consistent, putting you on the path to becoming elite performers.
Building observable systems (and what to avoid)
One thing elite performers do seemingly well is create tight process feedback loops using observability techniques and tools. They excel at building and operating highly observable systems. I use “systems” here quite loosely. In this context, I am referring not only to the services that get deployed, but also to the CI/CD pipelines, telemetry pipelines, and control planes for automation. Moreover, building observable systems includes observing the processes that govern software delivery and the standards these processes employ. In summary, elite performers are able to measure things in concise, reliable, and predictable ways across the software development lifecycle. They approach observability with intention using the least number of metrics or data points (concise), generated from consistent and high-quality data (reliable) that best represent process health and provide strong correlation to issues (predictable).
To have the most flexibility in building observable systems, when selecting toolchains, telemetry agents, telemetry pipelines, or control planes look for components that fully embrace and support open-standards. Open source and CNCF toolchains are great at being natively interoperable. Keep in mind that some vendors listed on CNCF fall into a gray area of supporting open standards but with proprietary closed-source code such as their agents that collect telemetry. Consider carefully before selecting a proprietary vendor and see if there are open-source solutions that will meet your requirements. Vendor supplied agents that are not open-sourced generally produce proprietary datasets that can only be read by the vendor’s backend platform, making their integrations exclusive. This is far from ideal as they keep teams vendor-locked around exclusive data that is difficult or much more expensive to democratize across the larger organization. Proprietary components in observability have historically resulted in IT having many disparate silos of data, limiting the effectiveness of entity modeling, machine learning, and the overall digital transformation of the enterprise. To become an elite performer, organizations should do everything they can to own their telemetry at the source, not lease it in the form of proprietary vendor code.
By leveraging an open standard like OpenTelemetry, you never have to worry about a vendor changing their licensing model in such a way as to severely impact data democratization as one APM vendor recently did by going back to per-user licensing. Your choices are to either pay them more to access your data or you ditch their technology, and in doing so, reset the clock on maturity along with any instrumentation and automation built against their platform. This is why elite performers opt to leverage OpenTelemetry and work with vendors like Sumo Logic that embrace opt-in vs lock-in for analysis. Seek out vendors that fully support open standards and toolchains rather than continuing to invest in or rely on a closed/proprietary agent or ecosystem for collecting your telemetry.
Another reason for OpenTelemetry’s success is that it’s a highly opinionated, open-source schema that does not have an opinion on how data is stored, aggregated, or processed. It simplifies/standardizes telemetry acquisition, unifies all logs, metrics, traces, and events into a new type of composite (and highly enriched) telemetry stream and enables sophisticated processing and transformations to occur in the collector pipeline. These capabilities combine to solve many data challenges in IT and especially within business intelligence teams that have historically struggled to access immutable real-time data.
Development teams adopting OpenTelemetry benefit the most by having a lightweight API and swappable SDK architecture, which means they are no longer reliant on a closed agent with technical debt outside of their control. If there is a bug or feature needed in OpenTelemetry, it can be fixed or written by the developer or anyone in the industry vs. waiting and relying on a small team of the vendor’s engineers. This was especially beneficial when the recent Log4J vulnerability was announced and resulted in massive disruption of every proprietary agent deployment. For OpenTelemetry, it was virtually painless.
Traditional application performance monitoring (APM) and observability tools are built on two or three pillars of data sources: traces and metrics mainly, with limited logging in many cases. Great teams instrument their systems to emit all three types into a unified platform of data to be the most observable. While traditional APM vendors have argued that you could eliminate one of the sources or rely heavily on one, all three have their role in creating observable systems.
For all the benefits of legacy APM, a major shortcoming was that it enabled teams to capture literally everything without thinking through what was important—mainly because it did not rely on developer input. Too much data without regard for its purpose leads to massive inefficiency. Building your systems with the intention of reliably inferring the internal state by the most efficient output possible produces telemetry that is deeply correlated with the enrichment necessary in metadata to satisfy the design outcomes. This leads to an optimized state where we can leverage fewer metrics in larger Cartesian sets to drive SLIs and operate more effectively by SLO and burndown.
OpenTelemetry lets you gather data from four sources: logs, metrics, traces, and Span events.
Logs, at their simplest, are a timestamped message and audit trail appended to a text file or database. For decades, APM vendors played down the need for logs, claiming there was more value in their proprietary traces. The argument was that traces would capture the exception logs and it was easier to diagnose a trace in conjunction with a user session than analyze a bunch of logs. The reality is we need both raw logs and traces. Today, more than ever with the explosion of components, stack complexity, change rates, and increasing attack surfaces, proprietary agents are at a disadvantage especially if their platforms are not robust at log aggregation. Unifying all telemetry means easily jumping from metrics to associated traces and logs, or vice-versa. Logs are critical to audit and compliance and in understanding the root cause through the sequence of things. What if something happens elsewhere that affects a set of traces indirectly? You still need the benefits of a full query language and search engine for logs to effectively determine root cause in many cases. In contrast to OpenTelemetry, proprietary tracing tools are limited by their proprietary data models, back-end platforms, and the simple fact that most don’t do logging well.
Metrics are aggregated time-series data about a system. Properly implemented, they are the canary in the coal mine: the most reliable method of detecting deviations that can then correlated with ML to both logs and traces in a temporal context and across the dimensions of available metadata. Metrics are great, but they are most useful when they are correlated to logs and traces in a unified way.
Where logs capture a moment in a system, traces follow a request through all of the components and moments. As metrics aggregate data emitted by a system, traces via OpenTelemetry tag the logs with trace and span IDs throughout the system making it simple to search and return a sequentially ordered set of logs from a trace ID. Traces also expose the actual code path, which is great for following the dependency chain and uncovering bottlenecks or other more exotic issues along the code path. I still run across IT leaders who don’t see the value of traces, and it amazes me every time. Traces are invaluable as they flatten the complexity of log analysis in deep systems by connecting all the logs emitted on that trace into the order they were emitted, which means log analysis remains linear vs. becoming exponential with the growth in complexity and expansion of cloud applications.
OpenTelemerty also adds a fourth data source: Span events. In essence, this is the equivalent of enabling deep code visibility to the span, such as stack traces or other events as defined by the framework or developer. There are a few projects now that are looking to go one step further and provide all the attributes in the objects on heap in the call tree as part of the stack trace when an exception is thrown. This will simplify the challenges of getting to the the root cause of those hard-to-analyze null pointer exceptions that never seem to show up in testing, but plague us in production.
If you’re not familiar with OpenTelemetry, I highly recommend becoming familiar with it and getting involved with the working groups, even contributing to the source.
Teams that successfully develop observable systems exhibit the following:
- DevSecOps and business analysis are intelligent, continuous, immutable, and real-time; data is unified and democratized
- Common instrumentation libraries are used across the organization; metadata is consistent and declarative
- Control plane and telemetry pipelines are consistent and declarative
- Observability is cleanly annotated and instrumentation is done with domain/aspect-oriented programming
- Metrics for monitoring health/performance are declarative
- Dashboards, alerts, and alert thresholds are declarative and deployed with each merge
- A control plane evaluates outputs against rules, and validates canaries, scales up/down, rolls back intelligently, handles level-0 auto-remediation well
I find that elite performers are mature in a lot of DevOps and DevSecOps subareas, like GitOps and Zero Trust. Interestingly, I am also seeing value stream management (VSM) and flow metrics emerging as a new framework for APM and as a way to express a more focused dimension of reliability for the business. If your software system is performing perfectly, but your customers aren’t happy, the process isn’t producing the desired outcome. Mapping out and observing your value streams is a good way of focusing efforts.
Ultimately, becoming an elite Performer means becoming obsessed with high data quality and leveraging MLOps more effectively. Having all this data in one place (ideally), allows ML to function more effectively and correlate more signals by exposing the relationships across these high-cardinality datasets. The more effective and reliable your analytics are at inference and dimensional analysis, the greater the impact on the speed at which you can recover from failure. When building observable systems, emphasize what data is collected, howdata is collected, and why data is collected so you can deliver high value information and knowledge to IT and business stakeholders.
Observability-driven development
I chose to write this section last because everything we’ve discussed up to this point is in one way or another a key element to the fundamentals of observability-driven development (ODD). ODD is a shift left of everything related to observability to the earliest stages of development. Much like test-driven development emphasizes writing test cases before writing code to improve quality and design, ODD does the same for building observable systems: developers write code with the intention of declaring the outputs and specification limits required to infer the internal state of the system and process, both at a component level and as a whole system.
ODD in practice can also become the forcing function needed for the organization looking to standardize instrumentation frameworks, SDKs, and APIs used to build observability or to standardize on how structured logging, metrics, traces, and events are implemented to ultimately fulfill the needs of the many stakeholders that need this data. With ODD, the principals of observability discussed herein are woven into the fabric of the system with both intention and precision.
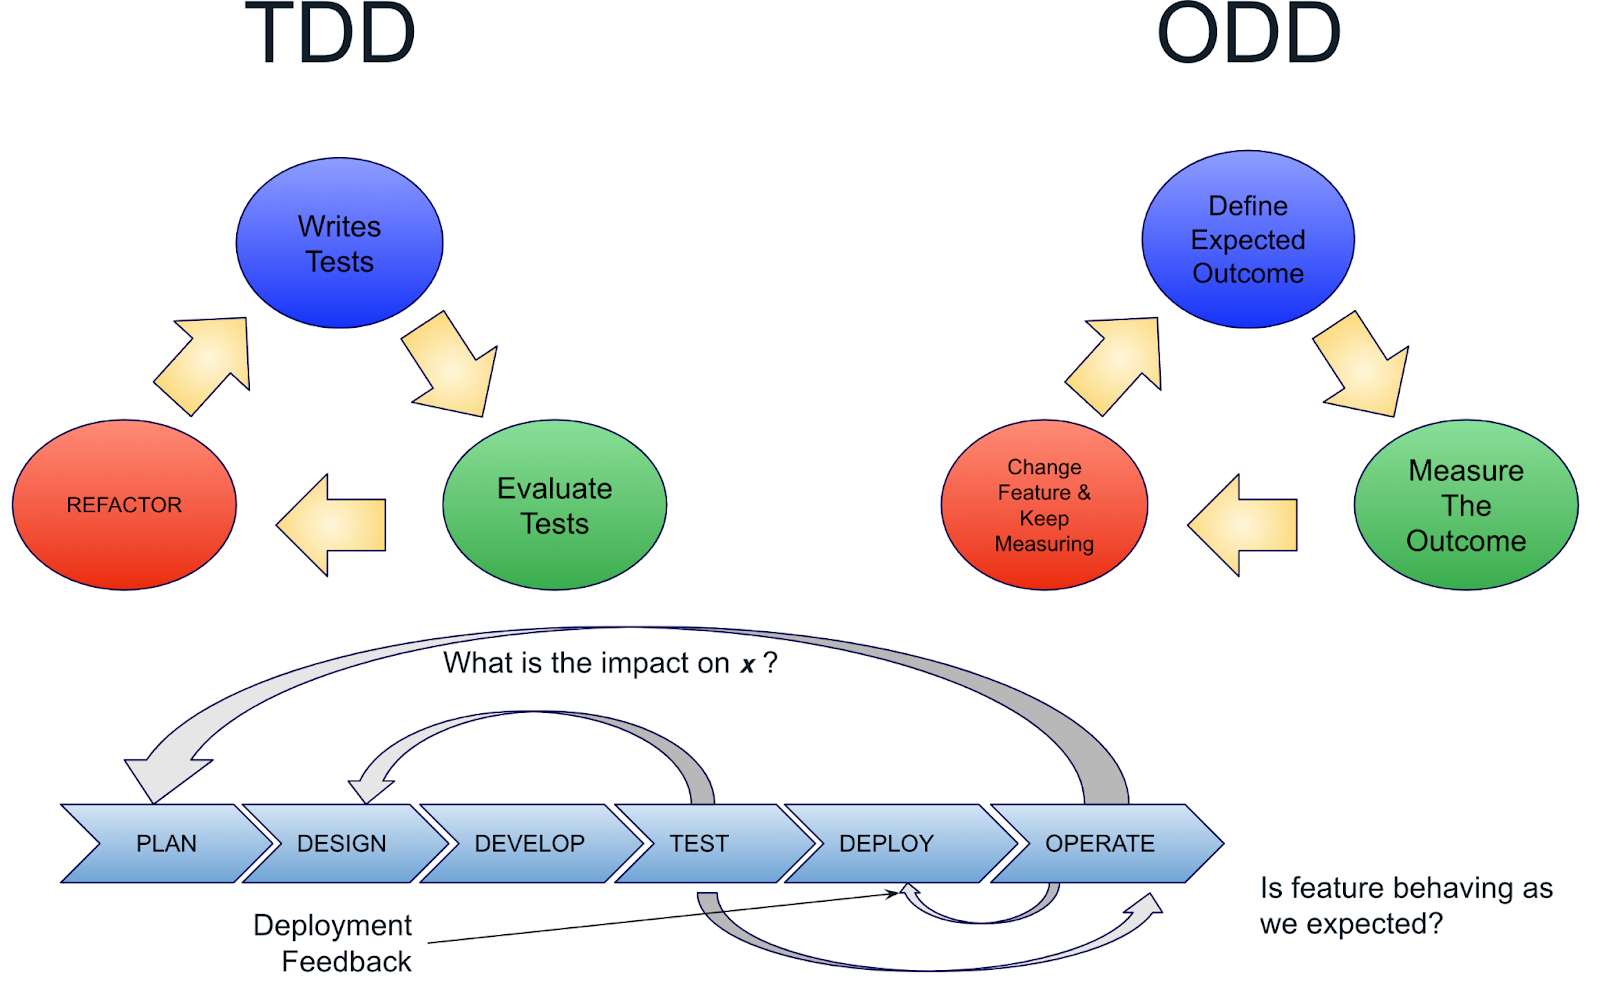
Where TDD created a feedback loop between the test and design, ODD expands the feedback loops ensuring features behave as expected, improving deployment processes and providing the feedback to planning.
I like to think of ODD as a bridge across what has historically been a very deep chasm that has diminished the developers’ relationship to production. ODD is all about giving the developer (and the business) the tools (and processes) necessary to build a tight and cohesive relationship with the production environment. In the process of doing this, everyone wins.
The ultimate goal of ODD, however, is to achieve a level of process capability that allows you to go straight from development to production. Testing in production has numerous benefits for the developer:
- The business, product managers, and developers can iterate more quickly through hypotheses.
- Data produced is of the highest quality when compared to non-production environments, where data is often either fake, scrubbed, or lacks good representation to production.
- DevOps teams improve their ability to automate, fail forward, feature switch, and roll back.
- Production testing will expose any processes that are not yet capable.
I recently interviewed an SRE for a boutique retailer that maintained normal operations throughout the peak retail season of 2021. The only thing they opted out of was their normal cycle of chaos engineering. Most teams that support retail operations opt out of a lot of their more onerous programs during the peak season. How did they accomplish this?
- Their engineering teams are free to push code to the production environments, provided their merge requests pass all the checks.
- Services are written with mocks that can be used by other teams so various failure modes can be tested on a dev’s laptop for downstream dependencies.
- They automate their performance tests of code in the pipeline (using compute budget that used to be earmarked for staging and lower environments).
- Those performance tests do many things, but perhaps most importantly they break their services over and over, looking for statistically relevant signals (think six sigma) in deviations while evaluating throughput and saturation against response times for new features which input to their SLOs.
- They completely destroy and rebuild their Kubernetes clusters each week, not because they have to, but because it keeps them reliable and confident in their capability of process in recovery.
- They leverage logs and metrics for all of their automation needs and leverage traces for optimizing customer experience and for rapid fault domain isolation of issues.
- All their data is tagged to the feature level.
- If their SLO budgets fall below the level of acceptable, new feature releases are restricted and change is limited to restoring service levels.
- They manage to the law of nines and rely on percentiles and exponential histograms for evaluating performance data.
In short, their journey into observability-driven development enabled them to fix many processes along the way to ultimately enable them to go from laptop and IDE directly to production with code. Their engineers have few dependencies on other teams that delay them, and their pipelines are robust and do a good job of certifying new code before merging to production, which they now do hundreds of times per day. By tracking numerous dimensions across their datasets they are able to expose outliers and understand behavior and performance characteristics over time with deep understanding. This high fidelity enables them to spot regression quickly and recover normal operations in well under an hour. Observability-driven development has enabled them to become elite performers.
What are your thoughts on observability driven development? Do you think you’re ready to to take your code testing to production?
About Sumo Logic
Sumo Logic, Inc. (NASDAQ: SUMO) empowers the people who power modern, digital business. Through its SaaS analytics platform, Sumo Logic enables customers to deliver reliable and secure cloud-native applications. The Sumo Logic Continuous Intelligence Platform™ helps practitioners and developers ensure application reliability, secure and protect against modern security threats, and gain insights into their cloud infrastructures. Customers around the world rely on Sumo Logic to get powerful real-time analytics and insights across observability and security solutions for their cloud-native applications. For more information, visit www.sumologic.com.
Ensure App Reliability with Sumo Logic Observability
Sumo Logic named a Challenger in 2022 Gartner Magic Quadrant for APM & Observability
The Stack Overflow blog is committed to publishing interesting articles by developers, for developers. From time to time that means working with companies that are also clients of Stack Overflow’s through our advertising, talent, or teams business. When we publish work from clients, we’ll identify it as Partner Content with tags and by including this disclaimer at the bottom.