
At Stack Overflow, we get questions and answers from coders who are professionals, hobbyists (sometimes both), and students. As most professional developers work Monday through Friday jobs, we’d expect to see the professionals ask job related questions on the weekdays and side project questions on the weekends.
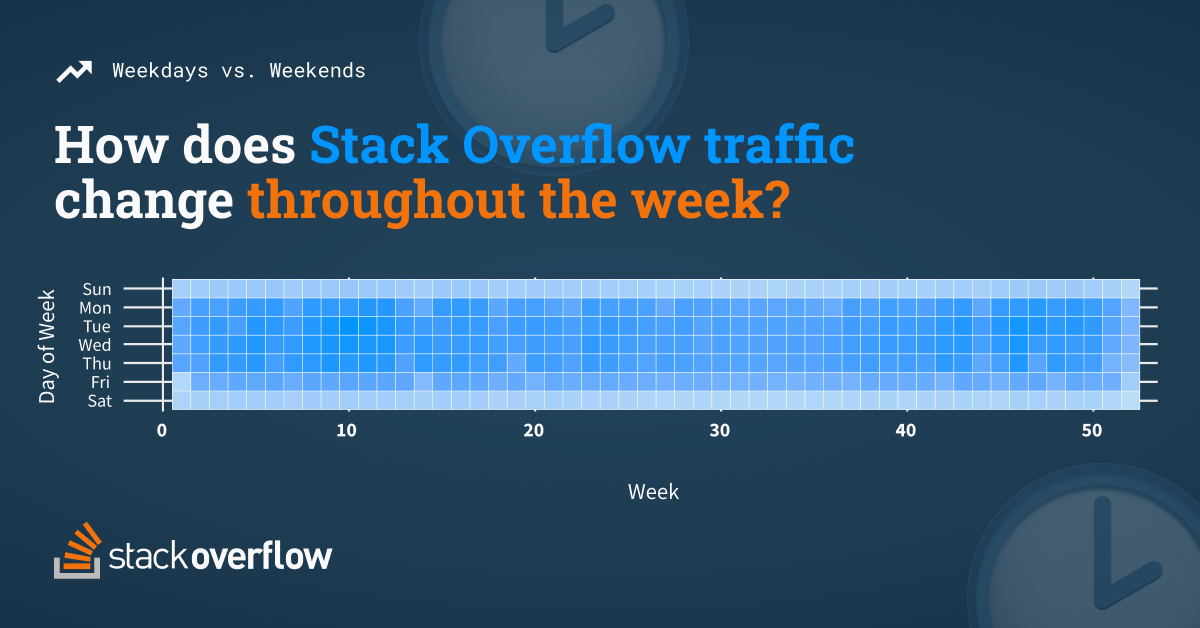
No, this is not the GitHub commits of an over achieving programmer but instead is the traffic to Stack Overflow for every day during 2021. Most of our traffic occurs during the work week (Monday to Friday)—85% to be exact. We took a look at these trends in the past (2017 and 2019), but the last three years have seen seismic shifts as the pandemic sent many people to work from home and many companies looking for ways to support their newly remote workforce. In this article, we’re digging into topics and trends across weekdays and weekends to uncover what technologies are working their way into the workplace, what topics are prompting the most questions, and areas where the community has the most answers.
In terms of question versus answer activity, we see both follow a similar distribution of the pageview heatmap above. There are 64% more questions posted on a weekday compared to weekend day and 61% more answers posted on weekdays compared weekend days.
The rise of the cloud
We shared previously that the pandemic accelerated cloud development significantly. We saw about four years worth of average annual growth in Q&A on cloud-related tags over the span of just three months at the beginning of lockdown in the U.S. Similarly, cloud topics are driving more weekday activity compared to activity on the weekend. In 2019, three of the top ten topics seeing the greatest variance between weekday and weekend activity were associated with the cloud. In 2020, that jumped to five of the top ten, and in 2021, it jumped up to seven of the top ten. In both years, all ten tags were directly related to technologies often used in a professional setting.
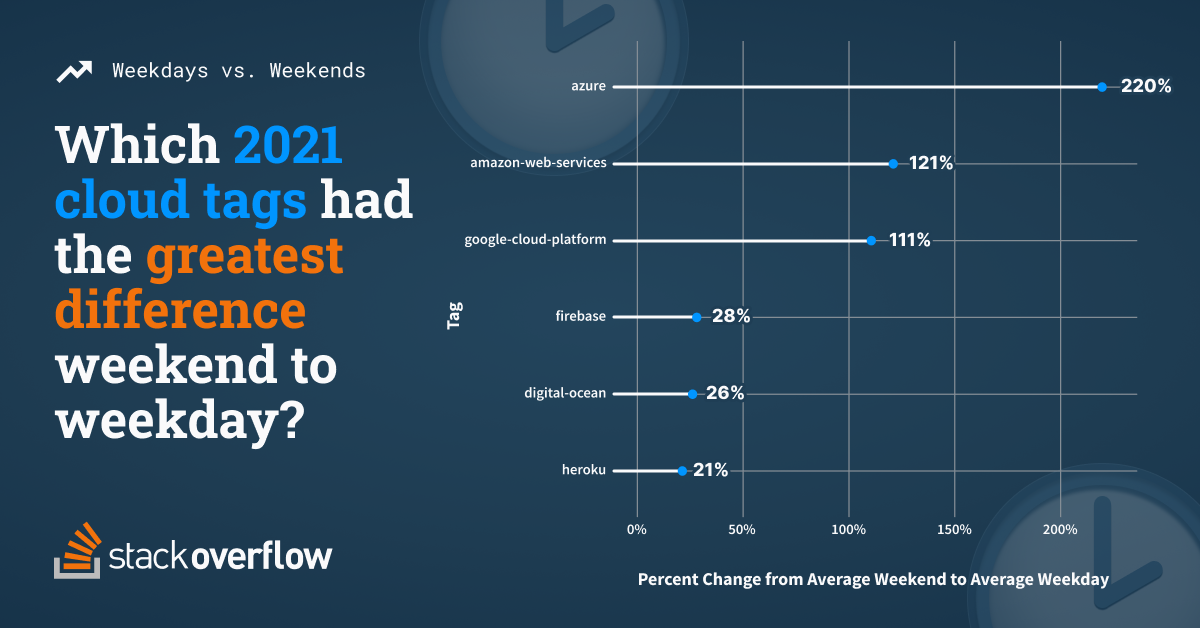
[CHART: Difference in average daily questions; Top 10 rankings for 2019, 2020, and 2021]
Over the last year, the Microsoft Azure tag saw the largest increase in questions asked between the average weekend and the average weekday, 220%. The AWS tag comes in second at 121%, and Google Cloud is third at 111%. What does that mean? Of the biggest three cloud providers, Google Cloud sees the most even activity from the weekend to weekday and from our 2022 Developer Survey we know that it is the second most popular platform among those learning to code. That said, AWS technically sees the largest volume of questions on weekdays and weekend days compared to the other two cloud platforms—by a long shot.
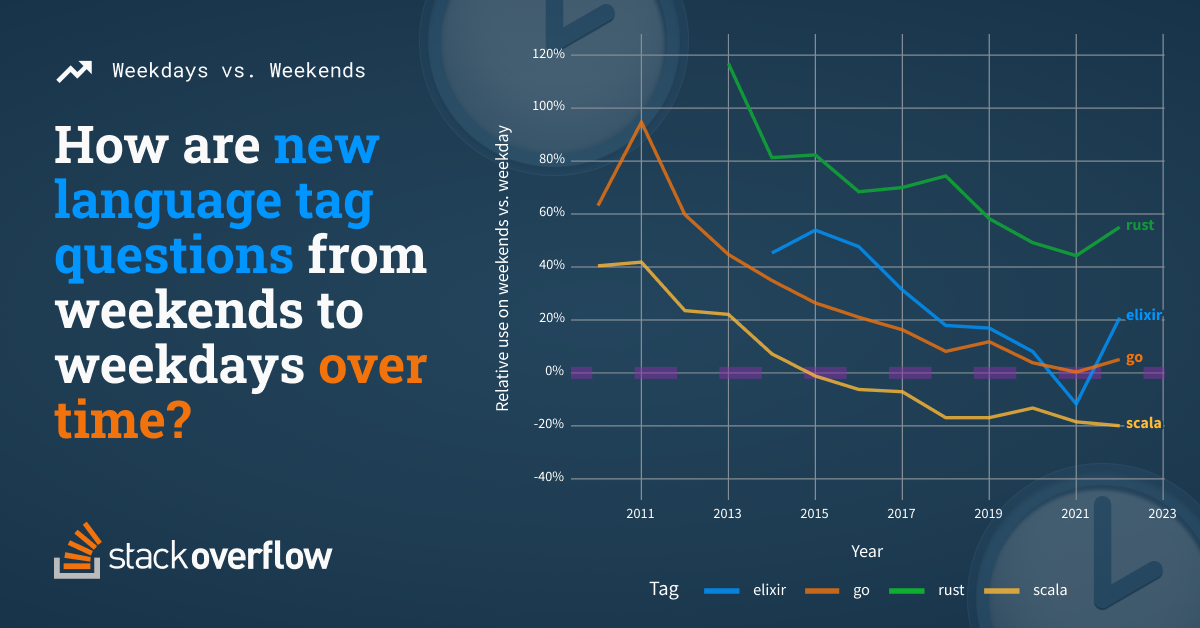
Another way to visualize this change over time is to compare the relationships between questions asked on weekends and weekdays, we can infer which technologies are more commonly used during the work week.
How to read this chart:
- Above the dotted line means questions asked are proportionally more on the weekends
- Below the dotted line means questions asked are proportionally more on the weekdays
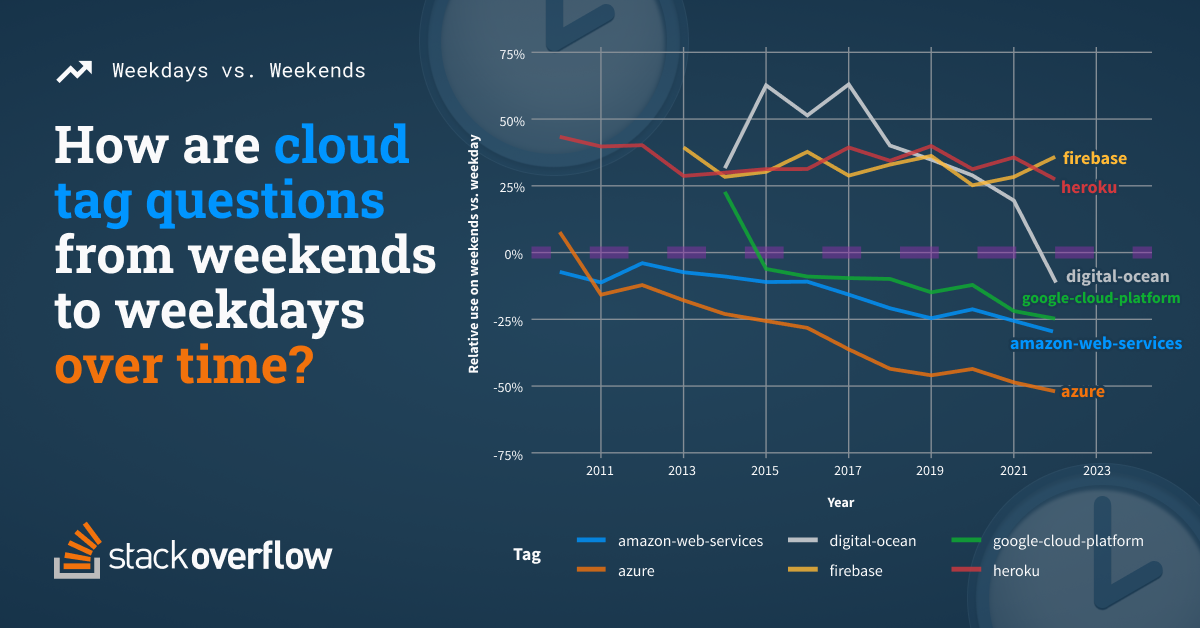
Above we can see that the azure tag continues to move further into the work week while heroku remains more popular during the weekend. This is supported by our Developer Survey results as we see Heroku being the cloud provider of choice for those learning to code and Azure being most popular among enterprises with 10,000 or more employees.
“Many legacy companies are moving to the cloud and newly formed businesses are utilizing a cloud-based infrastructure, so it makes sense to see these cloud tags being used more frequently during the work week,” noted Jessica Clark, Senior Data Analyst on Stack Overflow’s Platform Engineering team. “The same applies to these language trends. As languages such as Go and Scala become more mature, they become more prevalent in the workplace.”
What’s in (at work)
Digging deeper into what technologies are proportionally used more during the work week, we looked into the three trends that we have been observing on Stack Overflow: cloud, containerization, and machine learning. Open source machine learning tags see more activity on the weekends compared to weekdays where the services to train and deploy models in a production setting see more. Compared to containerization and cloud which seem to be scattered across both.
The larger cloud providers are dominating weekday activity (comparatively)—no surprise—while others are far more popular on weekend days. While we are beginning to see Docker become a fundamental tool for professional developers, Kubernetes sees more activity during the weekday.
How to read this chart:
- Similar to above but the further to the right means the tag is more commonly used on Stack Overflow
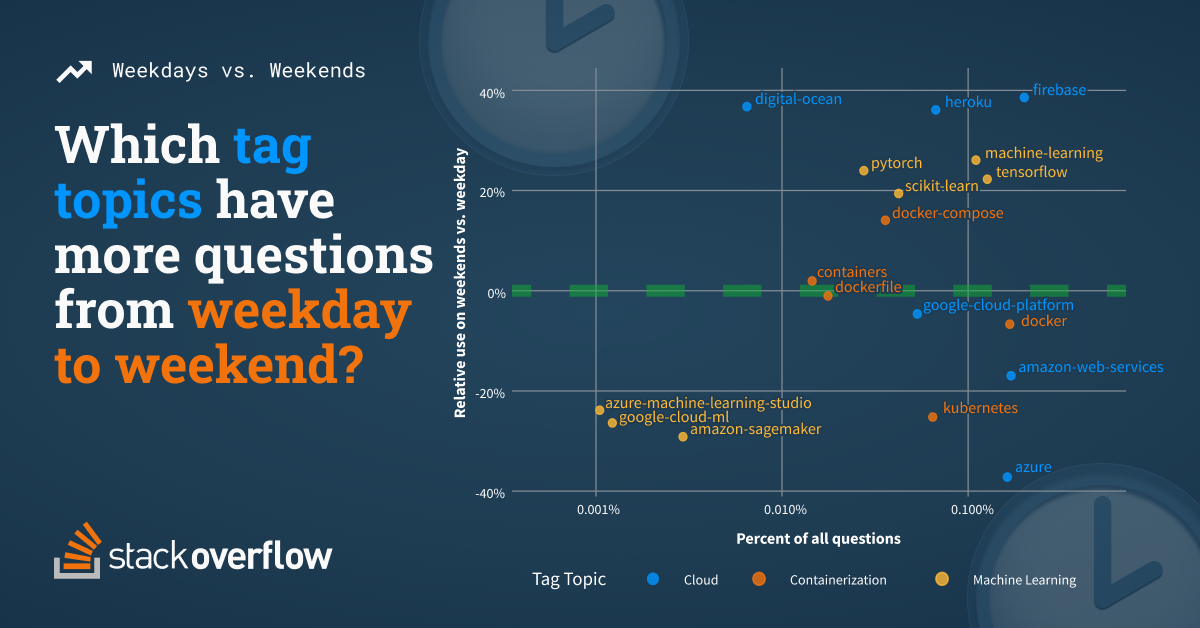
The top weekend tags—digital-ocean, heroku, and firebase—are all cloud-related products that help small teams and solo developers ramp up on their projects. The ones weighted towards weekdays are all products that benefit large enterprise projects—azure, kubernetes, and a trio of hosted machine learning projects. The job vs. hobby spit is pretty evident here.
We took a look at some popular “new” languages across the platform to get a feel for what is moving into the workplace based on comparative weekend and weekday activity. For instance, if we see popular weekend topics rising during weekdays (and stabilizing across all days), we can conclude that they are gaining popularity in workplaces. For languages, Rust, Go, and Scala are picking up during weekdays and the difference between weekend and weekday activity is steadily trending down since 2012.
“Scikit-learn, PyTorch, and TensorFlow are all open source ML frameworks that are popular for learning ML,” Jessica shared. “It’s not surprising to see these being used more frequently during the weekend.”
Conclusion
This data tells us a lot about how learning is trending across the community and the setting in which people are learning. With over 70% of developers learning to code online, what they are learning in their free time is frequently what makes its way into the organization they work for. Particularly when it comes to cloud, I personally think that the platform that provides the best developer experience is poised to win the cloud wars.
Note on our methodology
Since time zones are tricky and not everyone's weekend starts at the exact same time across the globe, we used standard U.S. Eastern Time as the boundaries for analysis but there is some variance in the data because of that. Cue someone asking about a four day workweek.